

Table of Contents
We studied 700+ campaigns to measure nonprofit text blast performance by delivery, response & opt-out rates. Here are the actionable insights.
Text messaging has shown its proficiency in the nonprofit sector over the past few years. Texting generates leads, substantial per-person donations and is an excellent tool to nurture supporters throughout their journey with you.
However, as more and more businesses and organizations turn to reap the benefits of this handy communication tool, your nonprofit must follow best practices to ensure you don’t drown in their noise. Hence, timing becomes absolutely critical.
The average person uses their phone for 5.4 hours every day. Texting (or chatting on instant messaging services) is the top activity in those hours. As a nonprofit looking to nurture supporters or make an ask, you want to catch them during these texting hours but also ensure that you don’t ping them when they are too busy.
So how do you get to the sweet spot?
By learning from the mistakes and successes of others!
To help you know the most effective and counterproductive hours for a nonprofit organization to send text broadcasts, we studied 232,000+ messages (this total includes outbound texts, responses, and opt-out messages) by 712 campaigns selected at random. Here’s what they tell us:
TL;DR
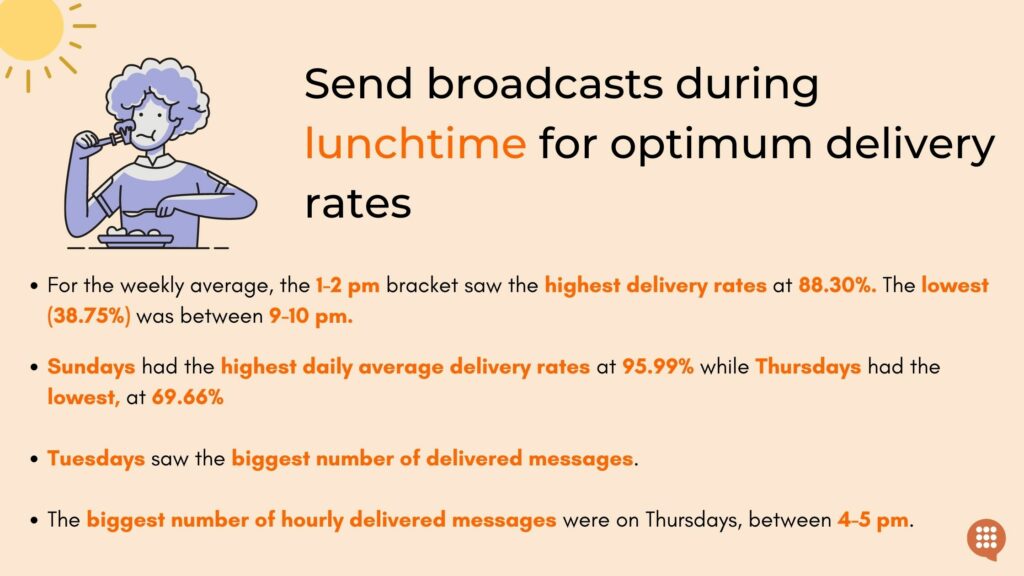
- The best delivery average rates were seen between 1-2 pm; the lowest was between 9-10 pm.
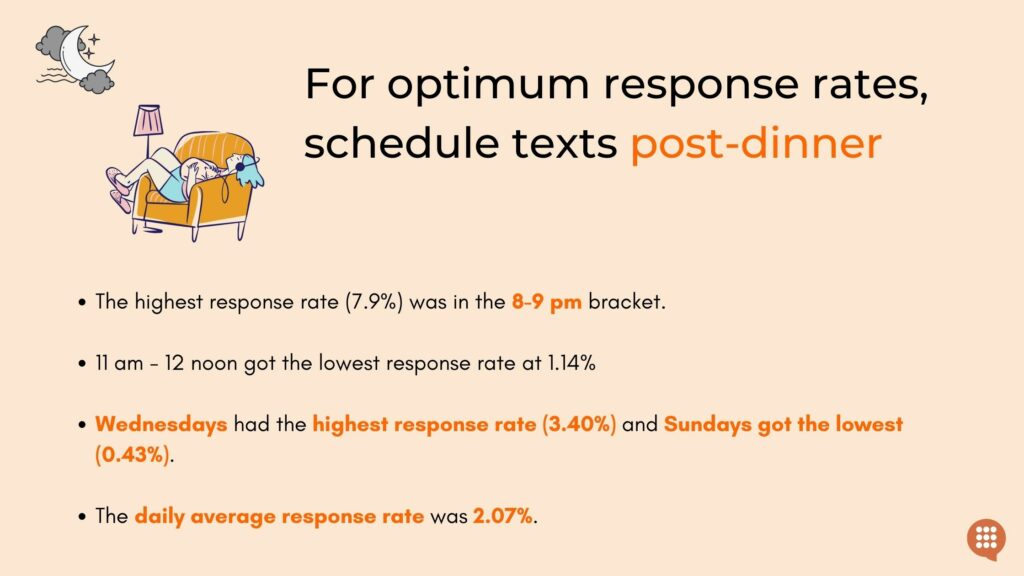
- Regarding response rates, the 8-9 pm bracket saw the highest weekly average (7.9%), while the lowest was between 11 am- 12 pm at 1.14%.
- On average, people were least likely to opt-out of nonprofit text broadcasts between 8-9 am (1.14% average) and most likely to do so between 8-9 pm (11.8% average).
But first, disclaimers:
- All the messages were sent by 501(c)(3) and 501(c)(4) nonprofit organizations using CallHub’s mass texting tools.
- We looked at the area codes the broadcasts targeted and converted the sent timings into local times of the recipients. For example, a text may originate in New York at 11 am but if it targets a donor in Alabama, it reaches them at 10 am. The same message sent at the same time to a donor in California reaches them at 8 am. Thus, studying the latter gives a better understanding of delivery, response, and opt-out rates.
- We’ve divided the day into 24 parts. The graphs, illustrations, and text mention the hours in a 12-hour format.
- About 2.06% of messages were sent before 8 am and after 9 pm on all days. We have excluded them from the final analysis because
- They fall beyond the recommended hours of business texting.
- The small number skews the delivery, response, and opt-out rates. For instance, 2 messages were sent between 1 – 2 am on Mondays. Both were delivered. 3726 broadcasts were sent on the same day, between 10-11 am, and 3304 got delivered. Would you consider the former 100% delivery rate a better estimate of the campaigns’ success or the latter 88.67?
- CallHub does not have access or permission to check the open or “read” status or time.
- Note that audience-initiated actions like opting out and sending replies can be done irrespective of when you sent the last message. We have included these metrics in the study so you can have contingency plans ready.
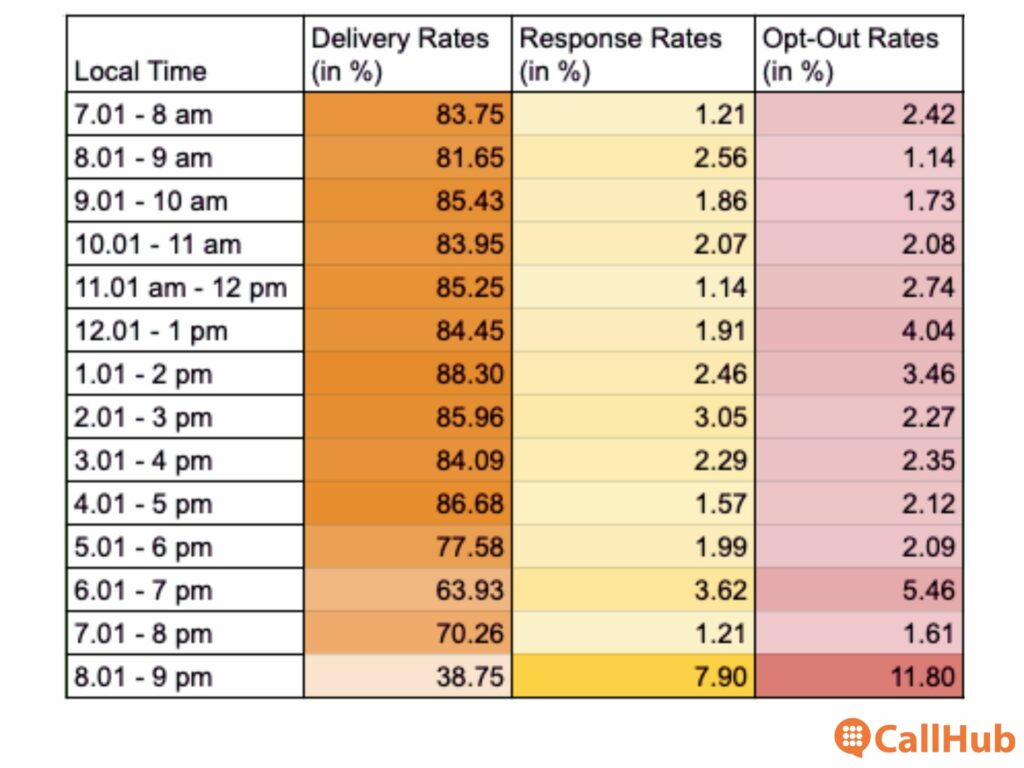
The following chart shows the average delivery, response, and opt-out rates of all days, per hour [calculated as (total delivered on all days ÷ total sent on all days * 100) and (total responses/opt-outs on all days ÷ total delivered on all days * 100).
Keeping these disclaimers in mind, let’s move on to the conclusions.
Nonprofit text broadcast delivery rate trends
Nonprofits send text broadcasts to their contacts expecting them to:
- Read the message OR
- Respond with close-ended (and typically prompted) replies.
Taking the desired action (e.g., clicking on links) follows either of the above steps.
If you are seasoned in the nonprofit communications industry, you know the 98% open-rate statistic very well. Let’s get deeper.
98% of all delivered messages are read. But how many sent messages get delivered?
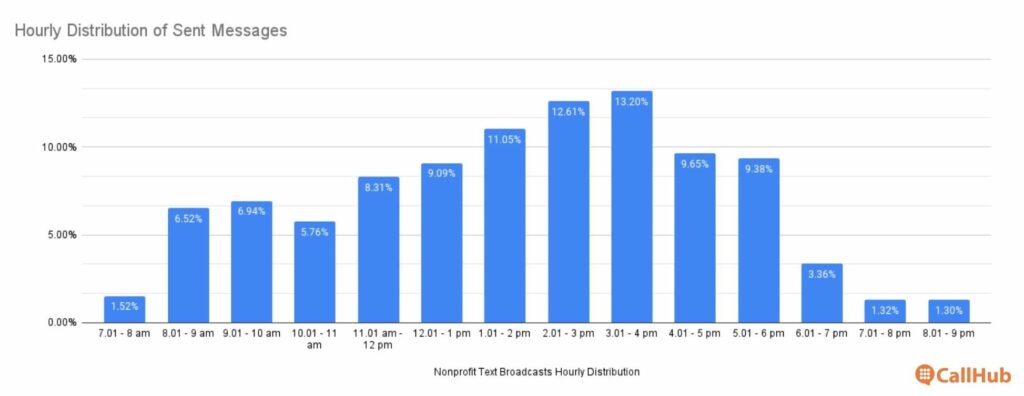
Hourly distribution of sent messages
First, let’s look at how broadcasts were sent throughout the day. The campaign day begins relatively slowly, and only about 15% of the messages are sent between 7-10 am. Afternoons see a much higher volume of sent broadcasts, and 55.6% are sent between 12-5 pm. The pace slows again in the evenings.
Hourly delivery rates
Our study reveals that an average of 78.57% of nonprofit text broadcasts were delivered throughout the day.
The 1-2 pm window received the highest average delivery rate at 88.30%, and the 8-9 pm window received the lowest, at 38.75%. (Refer to chart 1.)
Here’s a look at the hourly average delivery rates:
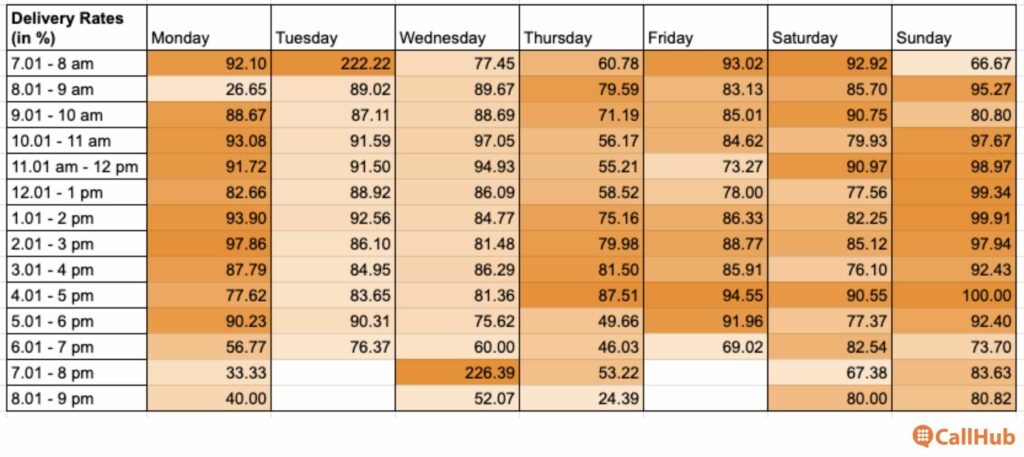
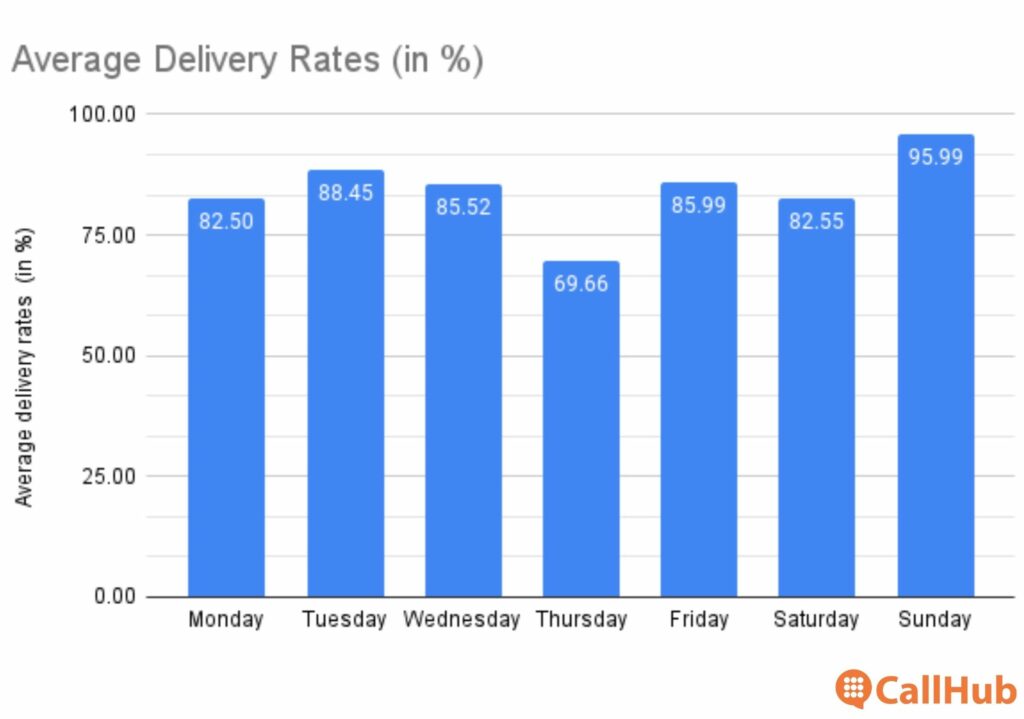
Daily delivery rates
Interestingly, Thursdays saw the most number of messages sent and the lowest delivery rates (69.66%). Sundays saw the highest delivery rate at a whopping 95.99%.
The average delivery rate throughout the week was 84.38%.
Messages can remain undelivered due to issues or roadblocks on three levels:
- Sender level: If your contact list contains invalid or bad numbers or landline numbers.
- Carrier level: If the carrier has blocked A2P messages or is facing a bottleneck in peak hours.
- Recipient level: If their phone is switched off or has no network for a long time.
While you cannot help a switched off our out-of-network phone, as a nonprofit organization using text messaging software, you hold power to iron out the first two discrepancies. Maintain a clean list of mobile numbers that have consented to receive your messages.
Weeding out bad or invalid numbers from your contact list and keeping mobile and landline numbers separate can improve your delivery rates substantially.
Read more about the best practices and tools to maintain a quality list here: Marie Kondo-ing Your Contact List: How to Clean an Existing Contact List.
Response trends to text broadcasts by nonprofits
The aim of text broadcasts is not always to get responses. When they do aim for replies, the prompt is usually sent in the initial broadcast, with a hint on how to respond. For instance, a message that says, “Would you like to attend the event? Reply YES or NO.”
We studied all received responses (these do not include opt-out messages) by the 700+ campaigns to see what hours and days receive the highest and lowest response rate.
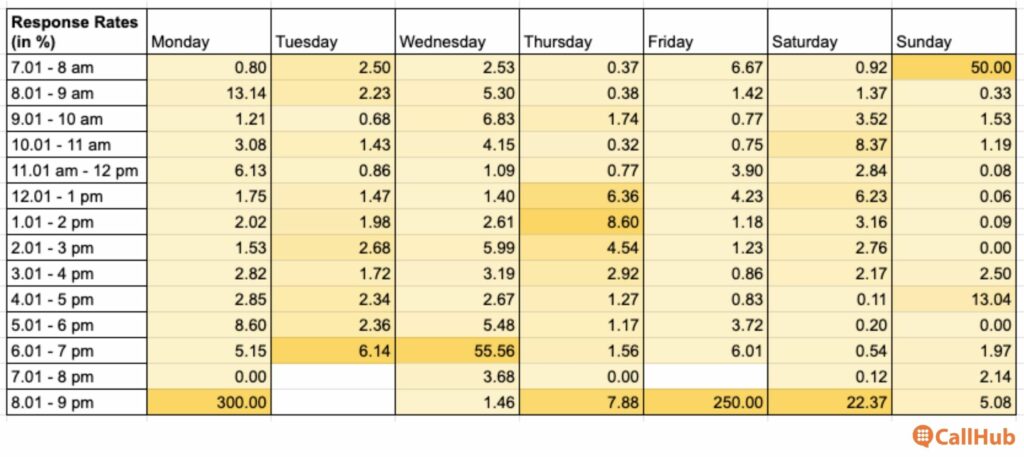
Hourly response rates
The average response rates throughout the day show interesting trends. For instance, although the 8-9 pm window got the lowest delivery rate, it got the highest response rate at 7.9%. The lowest response rate was in the 11 am-12 noon hour at 1.14%.
Overall, the average response rate throughout the day was 2.49%. (Refer to chart 1.)
Nonprofits usually send out broadcasts to contacts who have opted in to receive the communication. From the results above, it seems that these supporters are more prone to reply towards the end of the day.
The campaigns we studied sent only 5% of the total messages between 6-9 pm. The highest and second-highest response rates both fall in this window.
It would be a good experiment to see if the response rate increases if more broadcasts reach contacts in these times instead of the middle of the day.
Daily response rate
Much like the contrast between hourly delivery and response rates, Sundays too showed a very low response rate (0.43%), although they got the highest delivery rate.
Wednesdays were the winners on this front and got the highest response rate at 3.40%, followed by Thursdays at 3.09%.
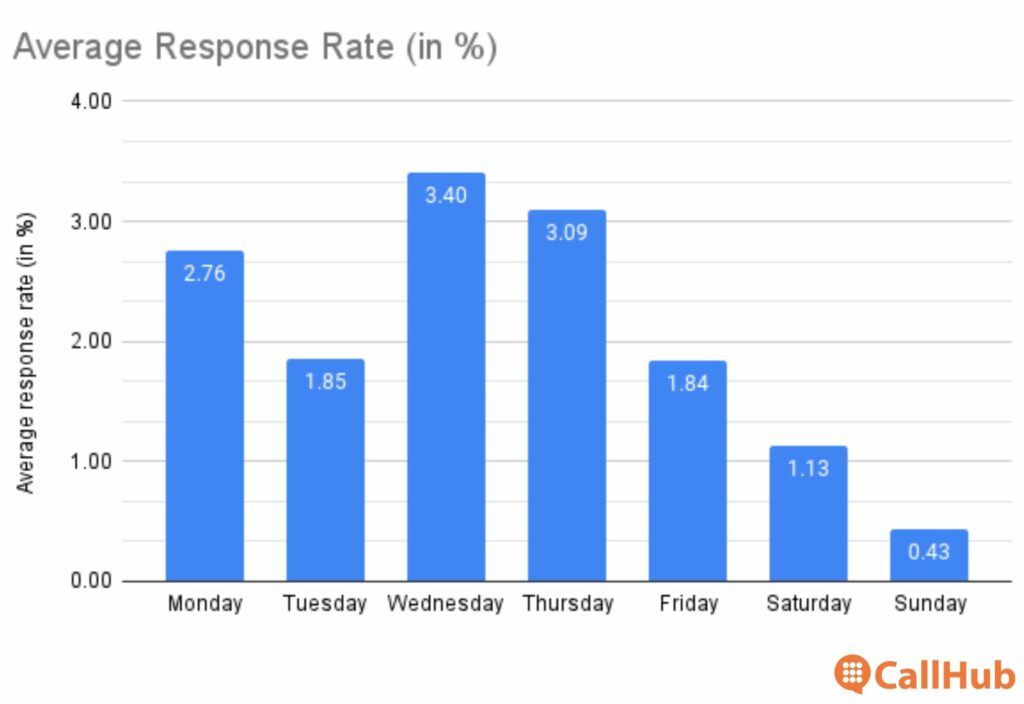
Mid-weeks are clearly a great time for nonprofit broadcasts looking to get responses. Wednesdays and Thursdays both got a substantial number of delivered messages as well as high response rates.
If your campaign is struggling to get responses to broadcast texts, try these mini-experiments:
- Schedule texts on Wednesdays and Thursdays within the time periods that have worked well for you in the past.
- Schedule texts on the days that work best for you but in the evening time slots.
Track performance continually and see which is yielding better results. But make sure you have added prompts for people to respond– the main ingredient to attract responses.
Opt-out trends
Opt-outs, like message opens and responses, can happen at any time of the day (or night). However, an irksome message at wee hours can be an easy trigger for someone to opt-out immediately.
Interestingly, only 6% of the opt-outs occurred beyond the recommended hours of sending texts (8 am – 9 pm). This is a good indication that nonprofits (on CallHub’s platform) complied with these hours.
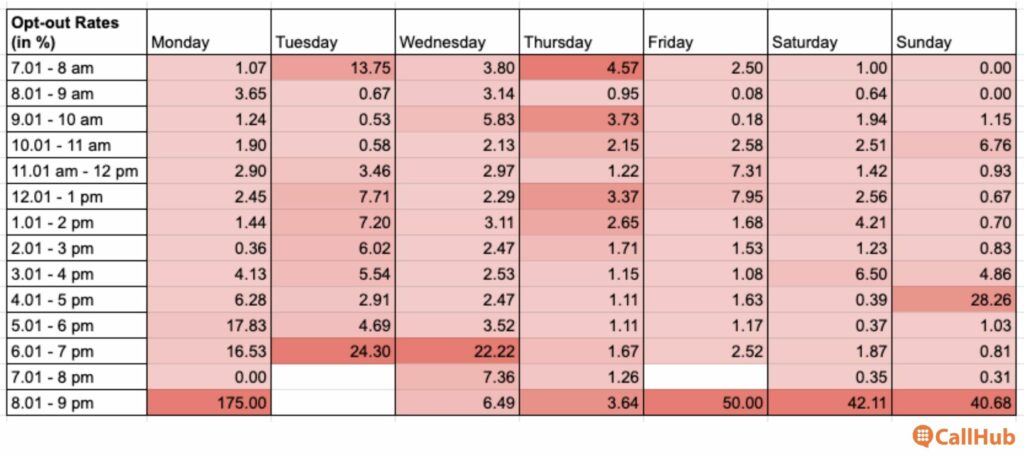
Hourly opt-out rates
With yet another roller coaster ride, the 8-9 pm window got the highest opt-out rates at 11.8%. This hour single-handedly increased the average opt-out rate to 3.24% (which would otherwise be 2.58%).
8-9 am got the lowest opt-out rate of 1.14%. (Refer to chart 1.)
Note that these are not necessarily indicators of the best or worst time to send a broadcast to supporters. For instance, people may not have opted out at 8 am simply because they were busy getting ready for work.
Similarly, even people who opted out at the day end (8-9 pm) may have received the last message from the nonprofit much earlier. They only opted out later.
Carriers do not allow tech platforms like CallHub access to check the “open” statuses or metrics. Thus, we cannot conclude what triggered them to opt out at this hour.
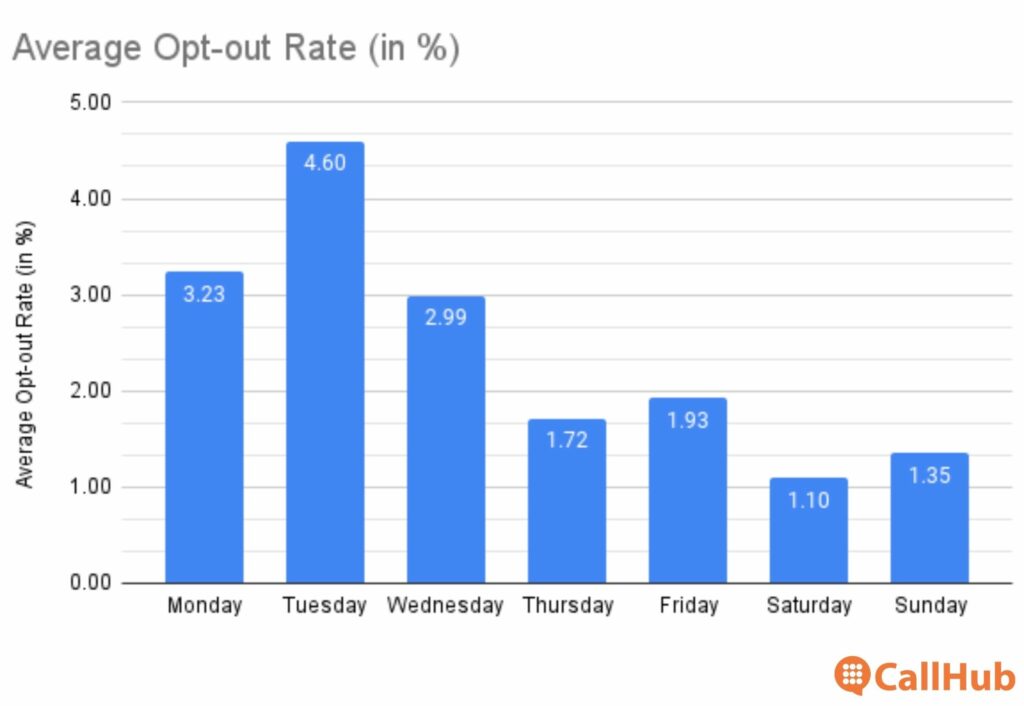
Daily opt-out rates
The opt-out rates start on a high during the week and slow down towards the weekend. Mondays saw a 3.23% opt-out rate, and it peaked on Tuesdays at 4.6%.
Saturdays saw the lowest opt-out rate at 1.1%, followed by Sundays at 1.35%. This indicates that weekends are a good time for nonprofit texting campaigns if their success metric is a low opt-out rate.
 Chart 5.
No one really wants people to opt out of their contact list. It can be a disheartening image to see people walk out of communications that you have built with great dedication and hope.
However, it is important to look at the bigger picture when it comes to mass conversations (especially via texts). People opting out of your lists may shrink your contact list, but it increases your delivery and response rates while bringing down costs.
It is important to give an easy way for people to opt out (on CallHub, you can simply click on a box to add the opt-out option to your text). But to ensure that the people still in your contact lists find your broadcasts worthwhile.
Here’s a handy guide to ensure that: How to send a text blast (With Best Practices & Examples).
To conclude
CallHub strives for excellence, whether in the texting and calling tools we provide or the best practices we suggest to our readers. As part of that endeavor, we wanted to study the trends of campaigns and offer unique, accurate insights to political campaigns, nonprofits, and businesses.
This article, in particular, looked at hundreds of campaigns that dealt with 232,000+ messages. Of course, no one can conclude any trend as the absolute truth. But through rigorous research and study, we can project outcomes to help your texting campaigns perform better.
If you have specific topics about calling or texting that we can research, mail us at [email protected] with the subject line: CallHub Research Ideas.
Feature image source: Sonja Langford/Unsplash.