You’re making hundreds of calls a day, but without analytics, you’re guessing which campaigns are working, which agents need coaching, and whether the effort is translating into results. Call center analytics gives you the data to answer all three.
Call center analytics — also called contact center analytics — is the practice of collecting, measuring, and acting on data generated by every call, text, and outreach interaction your team makes. With analytics, you review every touchpoint across calls, texts, emails, and chats, and use that data to improve agent performance, optimize call timing, and increase campaign ROI.
This guide covers the four types of call center analytics, the key metrics to track in each, how to measure ROI, and how CallHub’s analytics platform delivers all of them in one place.
What are call center analytics?
Call center analytics is your window into what’s working and what isn’t during your outreach. With analytics, you collect data and review every touchpoint across calls, texts, emails, and chats.
This gives you a clear direction on how to:
- Improve agent performance
- Improve customer satisfaction and resolution times
- Improve call conversion rates by identifying bottlenecks
- Optimize scheduling, routing, and workflows to enhance efficiency and productivity
- Catch problems before they escalate
Read also: The best call center management practices and strategies
Types of call center analytics you should know
There are four distinct types of call center analytics, each serving a unique purpose. Here is what each one tracks, which KPIs it produces, and how a campaign manager would act on the data.
1. Call interaction analytics
Call interaction analytics focuses on capturing and examining the details of every communication between your organization and contacts across all channels. It systematically tracks call outcomes (answered, missed, or requiring a callback) and conversation journey data including talk time, wrap-up time, and call duration.
For campaigns and nonprofits, these analytics help you understand which contacts are responsive, likely to vote or donate, and which numbers to remove from your list.
Key KPIs this type produces:
- Answer rate: percentage of outbound calls answered by a live person or machine.
- Unanswered call rate: calls that go to voicemail, busy signal, or no answer. Above 40% signals a list quality issue.
- Average call duration: below 20 seconds risks spam flagging by carriers.
Decision example: If your answer rate drops below 50% on a Tuesday shift, interaction analytics tells you immediately. You adjust call timing to Wednesday morning and watch it recover.
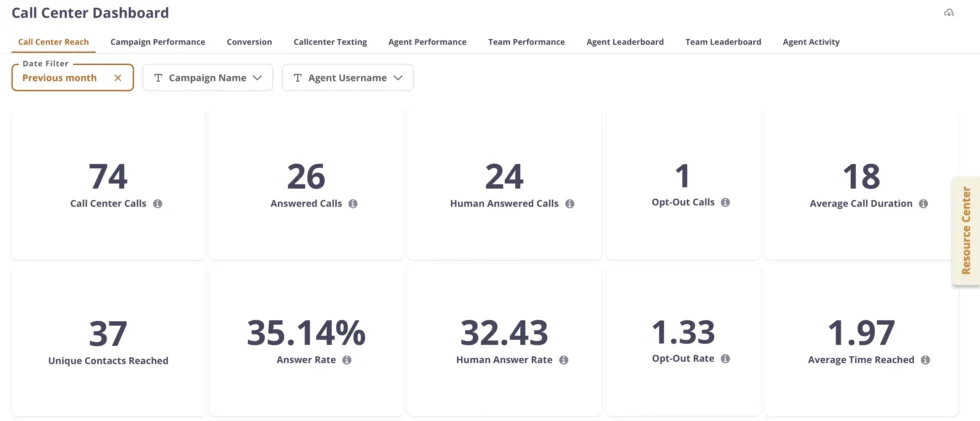
CallHub tracks all interaction data in the Reports > Calls > Campaign Calls section, filterable by campaign, date, agent, and disposition.
2. Speech analytics
Speech analytics, also known as voice analytics, utilizes AI to listen to, transcribe, and evaluate every call. It picks up on key phrases, tone of voice, and signs of compliance to give deeper insight into how contacts feel and how well agents are performing.
By reviewing call transcripts, you can identify opportunities to streamline conversations, offer self-service options, and coach agents more effectively, resulting in a 25–30% reduction in call handling time. (Source: CIO Economic Times — verify link before publishing.)
Key KPIs this type produces:
- Sentiment score: percentage of calls categorized as positive, neutral, or negative by AI analysis.
- Script adherence rate: how closely agents follow the approved script.
- Goal completion rate: percentage of calls where the campaign goal (RSVP, pledge, voter ID) was achieved.
Decision example: Sentiment analysis shows that calls mentioning a specific policy issue spike in negative sentiment. You update the script to reframe that talking point. Completion rates improve within a week.
CallHub’s AI-powered Smart Insights automatically transcribe and assess calls, categorize sentiment, and generate call summaries for faster review.
3. Text analytics
Text analytics evaluates every non-voice interaction including SMS, email, and survey responses. You can track key engagement metrics:
- Messages sent and received
- Reply frequency and response times
- Opt-out rates by message type
- Delivery status (sent, failed, or queued)
Key KPIs this type produces:
- Text reply rate: percentage of outbound texts that receive a response.
- Opt-out rate: percentage of contacts who unsubscribe per send. Above 2% signals a message tone or frequency issue.
- Delivery success rate: percentage of texts successfully delivered vs. failed or queued.
Decision example: Text analytics shows that SMS messages sent on Saturday mornings have a 3x higher reply rate than Friday evenings. You reschedule peer-to-peer texting campaigns accordingly.
CallHub tracks SMS and chat performance with metrics on sent/received messages, replies, out-of-office messages, and delivery errors. Reports are exportable by campaign or agent.
4. Predictive analytics
Predictive analytics utilizes past and current data to forecast future trends, such as call volumes, campaign results, or staffing needs. Spotting patterns in behavior helps campaigns plan smarter.
You can prepare for busy periods, improve scripts for better results, and schedule agents more effectively. It also helps predict when supporters or donors might stop engaging, so you can reach out at the right moment.
Key KPIs this type produces:
- Predicted contact rate: expected answer rate for the next calling window, based on historical time-of-day patterns.
- Churn risk score: likelihood that a supporter or donor will disengage if not contacted within a set number of days.
- Optimal call time: best calling windows by contact segment, derived from past campaign data.
Decision example: Predictive analytics shows your GOTV campaign historically achieves a 40% higher contact rate between 5:30–7:00 PM on weekdays. You front-load volunteer slots into those windows for the final week before election day.
Read also: Remarkably Effective Call Center Quality Assurance Guide
Real-time vs. historical analytics
Call center analytics data comes in two forms. Knowing when to use each changes how you manage campaigns:
| Real-time analytics | Historical analytics | |
| What it shows | Live call queue, agent status, calls in progress, active campaign dashboard | Trend analysis, performance reviews, campaign ROI, agent benchmarks over time |
| When to use it | During a calling shift — spot issues while you can still fix them | After a campaign or at weekly/monthly review to make strategic decisions |
| On CallHub | Analytics tab: live agent overview, calls in progress, answer rate updating by the minute | Reports > Calls: exportable CSV covering any date range, any campaign, any agent |
CallHub’s analytics dashboard provides both — a live view during calling shifts and exportable historical reports for post-campaign review.
How call center analytics improves campaign ROI
The ROI from call center analytics is concrete. Here is what it looks like in practice, and how to measure it.
Three ways analytics drives ROI
| ROI driver | How analytics makes it happen | Measurable outcome |
| Higher contact rates | Use interaction analytics to identify best call times by contact segment. Shift calling hours to match when your lists actually pick up. | Answer rate increases. More live conversations per volunteer hour. |
| Lower cost per contact | Use list analytics to identify and remove bad numbers before they burn dialing time. | Unanswered call rate drops. Cost per meaningful conversation decreases. |
| Agent productivity gains | Use speech analytics to identify where agents spend too long on calls and coach specifically. | Average handle time decreases. More calls per shift without adding headcount. |
A simple ROI framework for your calling campaign
Track these metrics before and after applying analytics insights. The gap between them is your ROI:
| Metric | Where to find it in CallHub |
| Cost per answered call (total cost ÷ calls answered) | Reports > Calls > Campaign Calls: Cost column ÷ Calls Answered |
| Answer rate (calls answered ÷ total calls made) | Analytics > Call Center Reach > Answer Rate |
| Cost per meaningful conversation | Filter Reports > Calls by disposition ≠ ‘No Answer’; compare cost |
| Agent talk time vs idle time | Analytics > Agent Reports > Total Talk Time vs. Total Connected Time |
The ROI of your analytics is the gap between these numbers before and after you start acting on the data. For example: if your cost per answered call drops from $0.18 to $0.12 after cleaning your list and shifting call times, your analytics investment has paid for itself in efficiency gains alone.
For the full reporting view behind these calculations, see our guide to call center reports and dashboards.
Key call center analytics metrics to track
Knowing the analytics types is the first step. Knowing which numbers to watch — and what to do when they move — is what turns data into better campaigns. See the full breakdown in our call center metrics and KPIs guide.
| Metric | Definition | Benchmark | Analytics type | If below benchmark |
| Answer rate | % of outbound calls answered by a person or machine | >60% outbound | Call interaction | Adjust call timing or refresh the contact list |
| Unanswered call rate | % of calls going to voicemail, busy, or no answer | <40% | Call interaction | Scrub list for bad numbers and DNC entries |
| Average Handle Time (AHT) | Total talk + wrap-up time per call | ~6 minutes | Speech analytics | Review transcripts for off-script patterns; coach agents |
| First Contact Resolution (FCR) | % of contacts where goal met without a callback | 85%+ (world-class) | Speech + interaction | Audit scripts for clarity; ensure agents have right information |
| Average call duration | Average seconds a connected call lasts | >20 seconds | Call interaction | Check dialer settings; verify list isn’t full of auto-disconnects |
| Agent talk time vs idle time | Time speaking vs logged in but waiting | Talk time >60% of connected time | Agent performance | Adjust dialer rate or reassign agents across campaigns |
| Sentiment score | % of calls categorized positive or neutral by AI | >70% positive | Speech analytics | Review negative transcripts; update script or training |
| Cost per answered call | Total campaign cost ÷ answered calls | Varies by list and dialer | Interaction | Optimize call timing and list hygiene to reduce wasted dials |
All of these metrics are available in CallHub’s analytics dashboard without additional setup. They update in real time during active campaigns and are exportable after any campaign ends.
Call center analytics use cases by campaign type
Call center analytics looks different depending on what your campaign is trying to accomplish. Here is how the four analytics types apply to the audiences CallHub serves:
| Campaign type | What to track with analytics | The decision it enables |
| Political phone banking | Voter contact rates by precinct, sentiment on key issues, best call times by district, volunteer performance by shift | Shift volunteer hours to high-contact windows; update scripts for precincts where negative sentiment is rising; identify which voter segments need follow-up |
| Nonprofit fundraising | Donor response rates by ask amount, pledge conversion rate, call duration on successful vs unsuccessful calls, agent disposition data | Identify which ask-amount script converts best; coach underperforming agents on phrasing; schedule next call within the optimal follow-up window |
| GOTV campaigns | Daily contact volume vs. voter turnout target, answer rate by day of week, completion rate for RSVP scripts | Adjust daily calling volume to stay on track; front-load volunteer shifts in the highest-answer-rate windows before election day |
| Advocacy calling | Issue-level sentiment scores, callback request rate, opt-out rate by message type, patch-through call completion rate | Replace talking points generating negative sentiment; prioritize callback requests; reduce opt-outs by adjusting contact frequency |
Get the best call center analytics with CallHub
CallHub’s omnichannel analytics platform combines data from all your communication channels — calls, SMS, chat, and email — into a single dashboard. This helps you see how contacts move between channels, where the experience is smooth, and where supporters drop off.
Call interaction analytics
- View detailed call outcomes, talk/wrap-up times, answer rates, unique contacts reached, and more
- Campaign-level and agent-level performance filtering for granular insights
Speech analytics
- AI-powered Smart Insights automatically transcribe and assess calls
- Sentiment analysis categorizes calls as positive, negative, or neutral and provides call summaries for faster review
- Contact categorization available through advanced dashboard tools
AI Powered Smart Insights video: Watch on YouTube
Text analytics
- Track SMS and chat performance with metrics on sent/received messages, replies, out-of-office messages, and delivery errors
- Exportable reports and filters by campaigns or agents for actionable data
Agent performance analytics
- Track key metrics per agent — calls dialed, talk time, connect time, average call duration, active vs idle time, and call outcomes
- Compare performance across agents or teams over custom date ranges
- Identify top-performing and underperforming agents with built-in leaderboards
- Use data to support agent coaching, performance reviews, and recognition programs
Read also: Get the Most Out of Your Campaign: Call Center Metrics
| CallHub offers Metabase analytics for Call Center campaigns — on request. It provides a comprehensive dashboard that tracks calls made, survey completions, answer rates per retry, call outcomes, and agent dispositions, making it easier to analyze and improve your campaigns. |
Frequently asked questions
What is call center analytics?
Call center analytics tracks and analyzes data from your outreach to help you understand and improve campaign outcomes. It gives you real-time stats including answer rates, agent activity and performance, time to call, and conversation outcomes. This lets you quickly identify what’s working, report your results, and adjust your outreach for better impact.
How can call center analytics improve my campaign results?
By identifying inefficiencies and opportunities for improvement, call center analytics helps campaigns:
- Increase contact rates by optimizing call timing
- Train and support agents more effectively using call transcript data
- Reduce wasted dialing costs through better list hygiene
- Increase first-contact resolution and reduce repeat calls
- Make data-driven decisions for staffing, training, and campaign optimization
How does call center analytics help with agent management?
It tracks detailed statistics for each agent including call duration, resolution rate, and script adherence, enabling targeted coaching, performance evaluation, and motivation through leaderboards and reports. You can compare agents across campaigns, identify who needs support, and recognize top performers all from the same dashboard.
Is CRM integration important for call center analytics?
Yes. Integrating analytics with CRM systems provides richer contact context and history, enabling agents to personalize outreach and allowing managers to spot trends across the entire customer journey. CallHub integrates with NGP VAN, NationBuilder, Action Network, Salesforce, and other CRMs, syncing call outcomes and contact data bidirectionally.
What is the difference between call center reporting and analytics?
Reporting shows what happened: historical data in table or list format covering calls made, outcomes recorded, and costs incurred. Analytics shows why it happened and what to do next: trends, patterns, and predictive insights derived from the same data. Both are available in CallHub. For a full breakdown of the report types, see our guide to call center reports and dashboards.
How can I get started with call center analytics?
Define the key metrics and goals for your team (answer rate, cost per contact, FCR). Choose a platform that integrates with your existing CRM and delivers both real-time and historical data. CallHub’s analytics are available to all accounts. Start with the analytics dashboard and export your first campaign report after your next calling shift.
Make every call count with call center analytics
Call center analytics gives you the visibility you need to understand what’s working, what’s not, and why. From tracking call outcomes and optimizing agent performance to identifying the best times to call and measuring campaign ROI, it turns every interaction into data you can act on.
Ready to track the metrics that matter? Explore CallHub’s call center software and start your first analytics-driven campaign.
Looking for the reporting side of analytics? See our complete guide to call center reports and dashboards for the full picture.