


Table of Contents
Call center metrics are nothing but key performance indicators(KPIs) that evaluate the efficiency, productivity, and overall performance using metrics like call volume, average handle time (AHT), first call resolution (FCR), average speed of answer (ASA), first responder rate (FRT), etc.,of your call center operations. These metrics offer valuable insights to managers on:
- How well are your agents performing?
- How satisfied are your customers?
- Whether your campaigns are achieving their intended goals or not.
In short, they help you measure success and spot areas for improvement.
Here’s why they matter:
A survey found that almost two-thirds of people will hang up if they wait more than 2 minutes on hold. Even more striking, 13% said they won’t accept any wait time at all.
So you see the pattern, right? The wait time is a crucial metric to monitor closely. But that’s not the only one. Similarly, there are numerous call center metrics that can ultimately make or break your campaign. The key is to track the right mix of metrics and KPIs, allowing you to continuously optimize performance and achieve your goals.
This post outlines:
- Essential call center metric measures to track,
- Their benchmarks
- How you can use them to improve your call center marketing campaigns’ performance.
Why it’s important to track call center metrics
Whether you’re running a campaign, handling customer support queries, or reaching out to prospects, knowing how your call center is performing is critical. Tracking the right metrics gives you the visibility and control needed to make smarter, faster decisions. Here’s why it matters:
- Improve customer experience: Metrics like First Call Resolution, Customer Satisfaction (CSAT score), and call abandonment rates help you understand where callers are struggling—and how to fix it for a smoother experience.
- Boost operational efficiency & cut costs: By analyzing handle times, wait times, and agent availability, you can streamline workflows and allocate resources better—saving time and money.
- Enable strategic decision‑making: Real-time insights from dashboards help you spot issues early, adjust on the fly, and make informed decisions instead of guessing.
- Drive accountability & training: Tracking individual and team performance makes it easier to provide targeted coaching, recognize top performers, and customer support continuous improvement.
Ultimately, call center metrics aren’t just numbers—they’re a direct window into how well your team is meeting your customers’ needs. When used right, they can unlock better results across the board.
Read Also: Powerful Call Center Analytics for Better ROI in 2025
Standard call center metrics
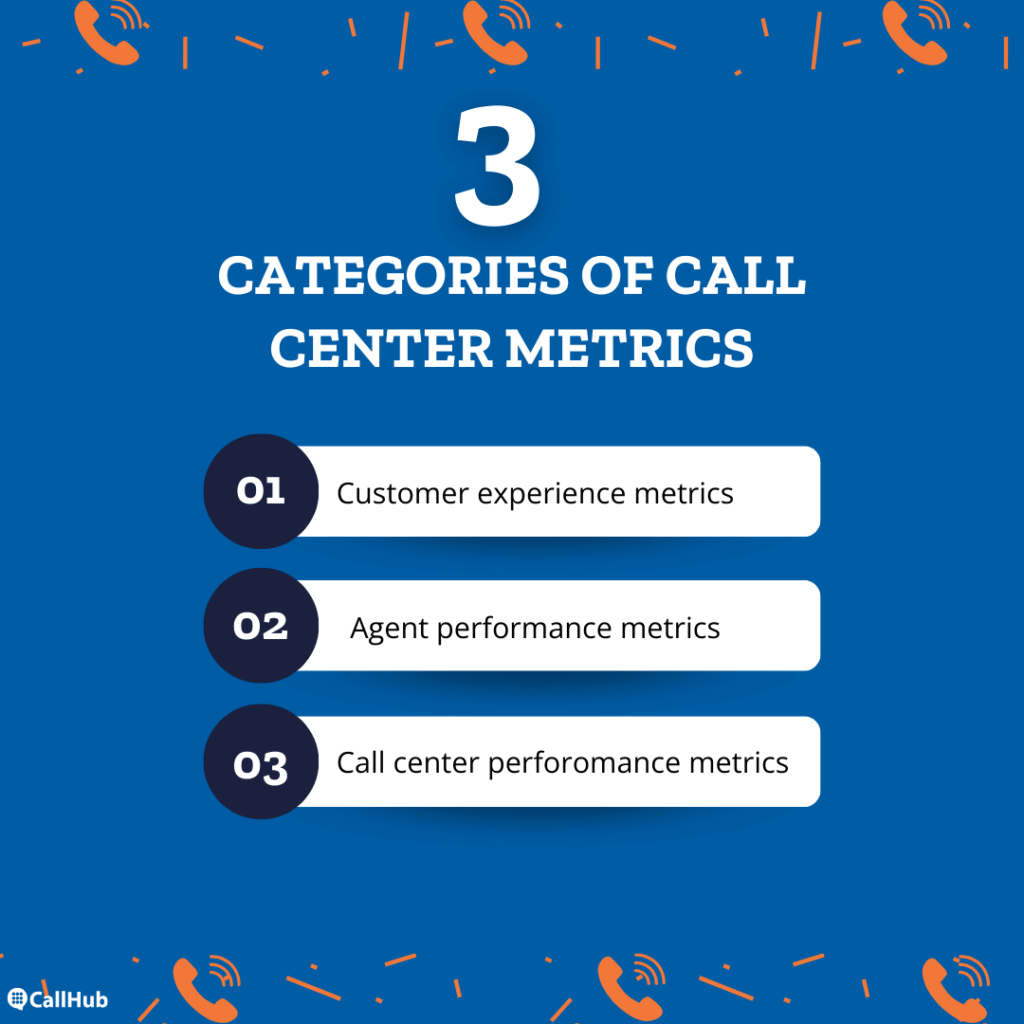
Here is a comprehensive list of famous call center metrics to track. We have broken down each metric into what it is, why it’s valuable, and what industries should track them. There are mainly three broad categories
Let’s begin.
1. Customer experience metrics
These call center metrics directly impact your callers’ experience and satisfaction.
a) Average call abandonment rate
What it is: The percentage of contacts who hang up before reaching an agent due to frustration.
Why it’s valuable: High abandonment rates indicate slow response times or insufficient agents.
Industry standard: 5%-8% (FCC-compliant organizations: 3%)
Relevant for: All industries
| Important note: You may exclude the incoming calls that hung up within the first 5 seconds of making the call as these calls are possibly misdials. |
How to calculate call abandonment rate:
| (Total number of abandoned calls / Total number of calls)*100 |
b) Percentage of calls blocked
What it is: The percentage of inbound callers who couldn’t reach an agent.
Call blocks can happen for one of two reasons:
1. There are not enough agents to handle the incoming calls or
2 Your agents are spending more time than required on calls.
Why it’s valuable: Indicates if there are too few agents or excessive call handling times.
Relevant for: Business
Industry-standard: Within 2%
How to calculate the percentage of blocked calls:
| (Total number of calls that go unanswered / Total number of incoming calls)*100 |
c) Average time in queue as call center metrics
What it is: Average wait time for contacts in the call queue.
Why it’s valuable: Directly affects call abandonment and caller satisfaction, because the more time your contacts wait in the queue, the more likely they will abandon the call.
Relevant for: Business
How to calculate average time in queue:
| Total time callers are in the queue / Total number of incoming calls |
d) Service Level
What it is: Percentage of calls answered within a specific timeframe.
Why it’s valuable: Shows if agents respond quickly enough.
Industry standard: 80/20 (80% of calls answered within 20 seconds)
Relevant for: Business
How to calculate the service level metric:
| (Total calls answered in a specific timeframe / Total number of answered calls + Total number of abandoned calls)*100 |
e) Average speed of answer (ASA)
What it is: Average time agents take to answer incoming calls.
Why it’s valuable: Longer ASA can cause dissatisfaction; it may indicate agent absenteeism.
Industry standard: 28 seconds (or ~25% of average handle time)
Relevant for: Business
How to calculate the average speed of an answer:
| Total wait time for answered calls / Total number of answered calls |
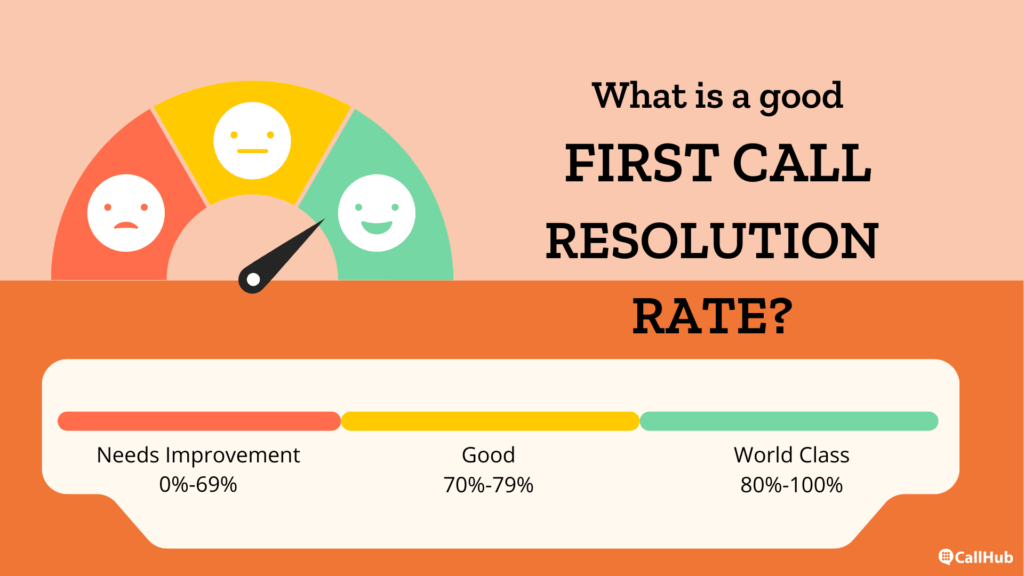
f) First call resolution (FCR rate)
What it is: Percentage of calls resolved on the first attempt without transferring, escalating, or returning the call.
Why it’s valuable: Reduces repeat calls and service costs; boosts customer satisfaction.
Industry standard: 70%-79%
Relevant for: Business
How to calculate first call resolutions:
| Total number of calls resolved in the first attempt / Total number of initial calls received |
g) Call Back Requests
What it is: The Number of requests for a callback instead of waiting on hold. You’ve probably heard them say:
“I’m busy right now. Let me call you back.”
Numbers prove it too, that 75% of customers prefer callbacks over waiting on hold.
Why it’s valuable: Indicates whether staffing is sufficient and enhances the overall experience.
Relevant for: All industries
Industry standard: Within 30 mins
h) Repeat Calls
What it is: Calls made by a contact regarding the same issue.
Why it’s valuable: Indicates unresolved issues on the first attempt. In one of the surveys conducted by Blinded by delight, 62% of survey respondents associated having to recontact an organization with disloyalty. One way to fix this is to introduce self-help options and appoint skilled and efficient agents.
Relevant for: Business
Formula:
| Number of calls on a specific issue by a contact / Total number of calls |
i) Average Caller Hold Time
What it is: Average time a caller is on hold during the call.
Why it’s valuable: Affects caller experience; high values indicate inefficiency.
Industry standard: 25.8 seconds
Relevant for: Business
How to calculate average hold time on call:
| Number of seconds contacts spent on holdTotal number of calls |
j)Average first response time (FRT)
What it is: The time between a customer raising a ticket and an agent addressing it.
Why it’s valuable: Recording and evaluating your FRT shows if you need to hire more agents to improve the response time.
| FYI: Your FRT needs to be as low as possible so your customers don’t need to wait long to resolve their issues. |
Relevant for: Business
Industry-standard: 43 seconds
How to calculate FRT:
| Total of first response times / Total number of cases resolved |
2. Agent Performance Metrics
These metrics help assess the productivity and efficiency of individual agents.
a) Average after-call work time as a call center metric
What it is: This shows the average time it takes for agents to do the work associated with a call after it is disconnected.
Why it’s valuable: A long ACW often signals inefficiency or outdated tools. If your numbers seem high, here’s what it could mean:
- Either your agents don’t have the best tools to wrap this up quickly
- They are inefficient
- There is too much information to note down.
Train your agents to be efficient by working with a tool with easy-to-access notes, tags, and saved templates.
| 👉 CallHub tip: Try to keep the average after-call work time under 30 seconds to increase your agents’ productivity. |
Relevant for: All industries
How to calculate after-call work time:
| Minutes spent doing after-call work by an agent / Total number of calls taken |
b) Average handle time
What it is: Average time an agent spends per call, including post-call work.
Why it’s valuable: Helps identify agents needing support or optimization.
Industry standard: 6 minutes 3 seconds (business)
| 👉 CallHub tip: This metric depends on your use case, the agent’s skills, and team size. So, use a call monitoring or call recording tool to listen to the calls. |
Relevant for: Business, political, nonprofit, and union
How to calculate average handle time:
| Total talk time of an agent + Total time contacts spent in the queue + After call work time / Total number of calls |
c) Agent utilization rate
What it is: Percentage of scheduled time agents spend actively working. So, if an agent works for 7 hours on an eight-day shift, the utilization rate is 87.5%.
Why it’s valuable: Balances productivity and prevents overstaffing or burnout.
Relevant for: All industries
How to calculate agent utilization rate:
| (Total time an agent spends working / Total time an agent is scheduled to work)*100 |
d) Average Call Transfer Rate
What it is: Percentage of calls transferred to another agent or department. The transfer can be to a supervisor or an unintended one due to poor interactive voice response flow.
Why it’s valuable: Lower transfer rate improves customer satisfaction.
Industry average: 9.9%
Features like call monitoring help managers assist agents and prepare them for future calls. CallHub’s Call Monitoring feature enables campaign managers to join a call and listen to the conversation |
Relevant for: Business
How to calculate the average call transfer rate:
| (Number of transferred calls / Total number of handled calls)*100 |
3. Call Center Performance Metrics
These metrics measure overall operational efficiency and cost-effectiveness.
a) Active waiting calls
What it is: The Number of calls on hold waiting to be answered by an agent.
Why it’s valuable: Shows the team’s ability to handle real-time call volumes.
Relevant for: Business
How to calculate active waiting calls:
| (Number of calls on hold at a time / Total number of calls being handled at the time)*100 |
b) Cost per call
What it is: Average cost of handling a call.
Why it’s valuable: This shows you how cost-effective your campaigns are.
Industry benchmark: $5.50 per inbound call, $6.46 per outbound call (business)
Relevant for: All industries
How to calculate the cost per call:
| The total cost of all calls / Total number of calls |
c) Call arrival rate as call center metrics
What it is: This shows the total number of calls received within a specific time frame, which can be days, hours, minutes, or seconds. It’s usually tracked at the end of the day.
Why it’s valuable: Helps determine your staffing needs depending on the call volumes.
Relevant for: Business
How to calculate call arrival time:
| Number of calls received in a day / Total number of hours/minutes/seconds in a working day |
d) Peak-hour traffic
What it is: Time of day when agents receive the highest call volume.
Why it’s valuable: Helps in scheduling agent time efficiently.
Relevant for: All industries
| CallHub Tip: To get this number, log the time of the day when you receive the most calls and find the most common hours in a campaign. |
e)Average call length
What it is: Average duration of a call (excluding pre- or post-call work).
Why it’s valuable: It is used to set work hour expectations and distribute workloads effectively.
Industry standard: 5 minutes 2 seconds (business)
Relevant for: Political, nonprofit, business, and union
How to calculate average call length:
| Total time agents are on calls with contacts / Total number of calls |
f) Answer rate (outbound calls)
What it is: Percentage of outbound calls successfully answered.
Why it’s valuable: Shows how effective your outreach is and how well your contact list performs.
| 👉 CallHub tip: To improve your answer rate, enable automated retries, inbound calls, texting from the call center, and use a spam label shield to display your organization’s name on the contact’s mobile screen. |
Relevant for: All industries
How to calculate the answer rate for outbound calls:
| (Total number of answered calls / Total number of dialed calls)*100 |
Here are the benchmarks for answer success rate by industry:
| Industry | Benchmark |
| Business | 40%-50% |
| Political | 70%-80% |
| Nonprofit | 20% |
Call center metrics reporting dashboards
A call center reporting dashboard is an intuitive visualization tool that displays call center metrics. This helps you monitor your call center campaign performance and optimize it periodically or over time.
CallHub is a call center software with a wide range of analytics and reporting tools to help you
- Measure and analyze the performance of your calling campaigns.
- Increase your agents’ productivity.
- Improve conversion rates.
You can access these reports on your campaign manager’s Home Page > Analytics. You can customize your reports to track the metrics that matter most to your campaigns.
Here, the overview panel highlights the following elements:
- Number of calls
- Reach rate
- Unique contacts reached
- Average time reached.
These and other call center reporting metrics can help you track campaign performance in detail.
Here are the ten metrics you have direct access to on CallHub:
- Answer/reach rate
- Average call duration (per day and throughout the campaign)
- Number of calls made (daily/weekly/monthly)
- Unique contacts reached
- Agent performance (by calls made, talk time, and connect time)
- Agent recruitment
- Agents making calls over time
- Team leaderboard (calls made over time, connect time)
- Dispositions
These call center metrics are available on your CallHub call center analytics dashboard. The tables can be imported as CSV, Excel, or PDF files. You may also copy select rows and paste them to the desired sheet.
Read Also: Powerful Call Center Analytics for Better ROI in 2025
Best practices to improve call center metrics
Now that you know which metrics to track, the real question is: how do you actually improve them? The truth is, not every metric matters for every campaign. What matters is choosing the right ones, acting on insights, and giving your agents the tools they need to succeed.
Here are six practical best practices—with real-world examples—to help you hit those benchmarks.
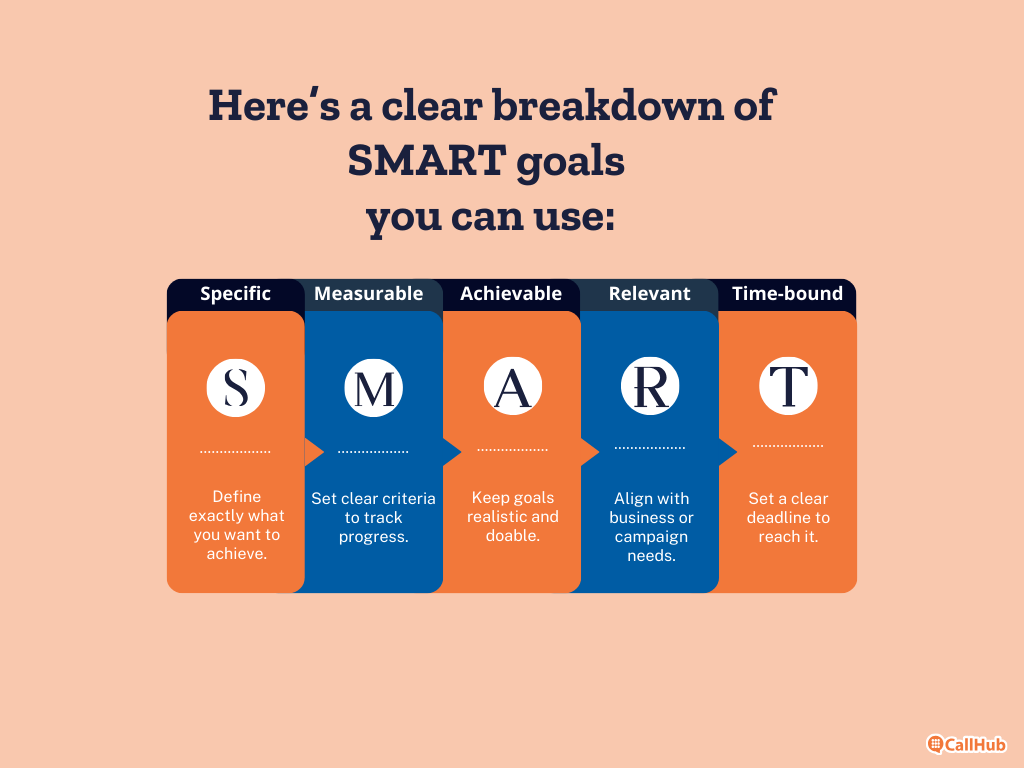
1. Set realistic and achievable goals
Don’t aim for perfect metrics overnight. For example, if your first-call resolution is currently 60%, set a goal to reach 70% in three months rather than 100%. Using SMART goals ensures your targets are clear and attainable, keeping your team motivated.
2. Monitor progress over time
Here is a table that shows how often to track a few important metrics
| Metric | How Often to Measure | Example – Political Campaign | Example – Non-Political/business |
| Call Abandonment Rate | Weekly | Monitor if voters hang up before reaching an organizer during GOTV (Get Out The Vote) | Track abandoned calls on a retail helpline during sales weekends. |
| Average Handle Time (AHT) | Weekly/Monthly | Check if volunteers spend too long answering voter FAQs. | Assess if customer service reps are resolving donor queries efficiently. |
| First Call Resolution (FCR) | Weekly | See how often voter registration issues are solved in the first call. | Track whether donors get answers without calling back |
| Agent Utilization Rate | Monthly | Ensure campaign staff are scheduled effectively without burnout. | Ensure that call center staff in a nonprofit hotline are neither under nor over-utilized. |
| Answer Rate | Weekly | Track voter answer rates to identify if contact lists need cleaning | Measure answer rate for outbound sales calls to spot spam labeling issues. |
| Service Level | Weekly / Monthly | Ensure 80% of voter calls are answered within 20 seconds | Verify that customers on a support line are connected promptly. |
3. Conduct agent training regularly
Regular coaching helps agents improve faster. Use top-performer call recordings to show examples of handling tricky donor calls, political outreach, or customer complaints. Scenario-based role plays, combined with interactive scripts, allow agents to practice responding naturally rather than reading verbatim.
4. Leverage technology effectively
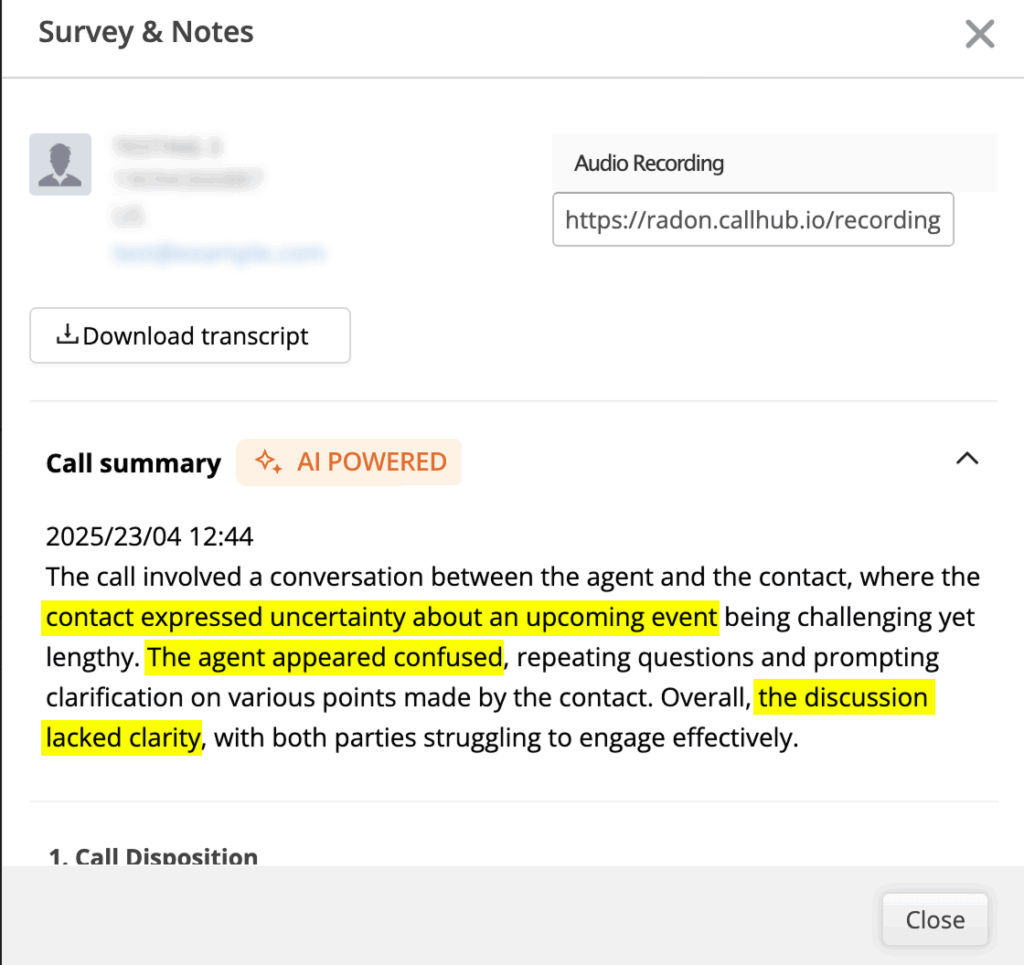
Tools like CallHub make agents’ lives easier. For example, during a nonprofit fundraising campaign, CallHub’s CRM integration shows donor history before the call, while AI transcription and notes automatically capture conversation highlights.
5. Use data and analytics to identify areas for improvement
Look at metrics like repeat calls or average hold time to uncover bottlenecks. For example, if voters in a political outreach campaign keep calling back with the same questions, it may indicate unclear messaging—prompting script adjustments or additional agent training.
Agents can follow up with donors quickly and personally, improving engagement and conversions. Automated workflows also reduce repetitive tasks, letting agents focus on meaningful conversations.
6. Review and refine processes continuously
Don’t let metrics stagnate. After each campaign, review performance with questions like:
- Did call volume spikes overwhelm agents?
- Did callback requests rise?
Use these insights to tweak scripts, staffing schedules, or workflows. Over time, these small adjustments can drastically improve customer or contact experiences.
FAQs: Call center metrics
1. What are the top 3 call center metrics?
First Call Resolution (FCR), Average Handle Time (AHT), and Customer Satisfaction (CSAT).
2. What are the metrics of a call center scorecard?
Customer experience (CSAT, FCR), agent performance (AHT, utilization), efficiency (ASA, service level), and cost (cost per call).
3. What are the 3 A’s of metrics?
3 actionable metrics are: Accuracy, Actionability, and Accessibility.
4. What should a scorecard measure?
Customer satisfaction, agent productivity, operational efficiency, and cost-effectiveness.
5. What are the four main areas a Balanced Scorecard measures?
Customer perspective, internal processes, learning & growth, and financial performance.
Turn insights into action with CallHub
Call center metrics are more than just numbers—they’re a window into how well your campaigns serve customers, supporters, or voters. By setting realistic goals, training agents, leveraging technology, and continuously reviewing performance, you can boost efficiency while delivering a better caller experience.
With CallHub, tracking and improving these metrics becomes effortless. From CRM integrations that personalize conversations to real-time dashboards and AI-powered insights, CallHub gives you everything you need to monitor performance and act on data.
👉 Schedule your demo today to see how CallHub helps you track and optimize call center metrics with ease.
Featured image: Photo by Lukas