

Text broadcasts and mass texting have become common for political campaigns to stay in touch with constituents. In some cases, their aim is only for recipients to read the message, and in other cases, they aim for contacts to send close-ended replies.
How successful a text blast campaign becomes in these goals depends on three crucial factors:
- Messaging
- Segmentation and targeting
- Timing.
We’ve covered the first two elements in our guides (links below). Now, we dive into the best and worst times to send a political text blast.
The timing of a political text blast is always crucial– whether your list is organic or purchased. Send a broadcast when a supporter is busy, asleep, or just not in the mood to receive text blasts, and you risk losing them from your list.
So, when should a political campaign send a text blast, and when to avoid it?
There’s no definite answer to that. But, one can only learn from the past campaigns and try to iron out shortcomings for the next one.
To help you, we analyzed 780,000+ political text blasts sent in the USA and Canada between January and June 2021. Our aim? To see the best and the worst performing times and days for a political text blast.
Jump to the “Takeaway” section for a quick overview of the results.
What 780,000 political text blasts tell us
We studied the statuses of 786075 messages sent from CallHub over six months in 2021 and compared them against the time and days they reached the intended numbers. The total number also included undelivered messages– texts that may be delivered later than intended due to temporary blockages or stayed undelivered due to permanent jams.
The statuses we studied are as follows:
- Sent: Total number of messages sent from the campaign’s side.
- Delivered
- Undelivered
- Opt-out: When replies were words like STOP, QUIT, UNSUBSCRIBE or CANCEL and requested to be delisted from the contact list.
- Responses: Any reply apart from opt-outs.
The trends of sent vs. delivered and undelivered, opt-outs, and responses can give us a good understanding of the timings best suited for political text blasts.
Now, the “best” and “worst” times can be subjective. They may change from campaign to campaign and according to the situation.
But the average rates of the above metrics compared by different timings and days can outline what time brackets are typically advantageous to a political text blast and what are disadvantageous.
Total texts: All the messages we studied targeted numbers registered in the USA and Canada. To ensure a truthful view of the campaigns, we broke down the list by area codes. All the hours presented to you are in local timings.
Nature of texts: The nature of the text broadcasts differed. They targeted supporters, volunteers, and audiences based on specific demographics or characteristics (supporter-agnostic).
Time-wise distribution of texts:
- Each day is divided into 24 parts. In the graphs, the hours appear as 00:01- 01:00, 01:01 – 02:00, etc., and follow the 24-hour format. In the text, they are given in a 12-hour form for ease of reading.
- The timings are all from the recipient’s POV, not the originating place of the message.
- For the most part, the texts follow TCPA regulations and are sent between 8 am to 9 pm. About 0.7% of messages were sent before 8 am and after 10 pm throughout the week. We haven’t considered this negligible data in our analysis to comply with research norms.
Now, let’s get to the juicy part.
Total messages sent per day per hour
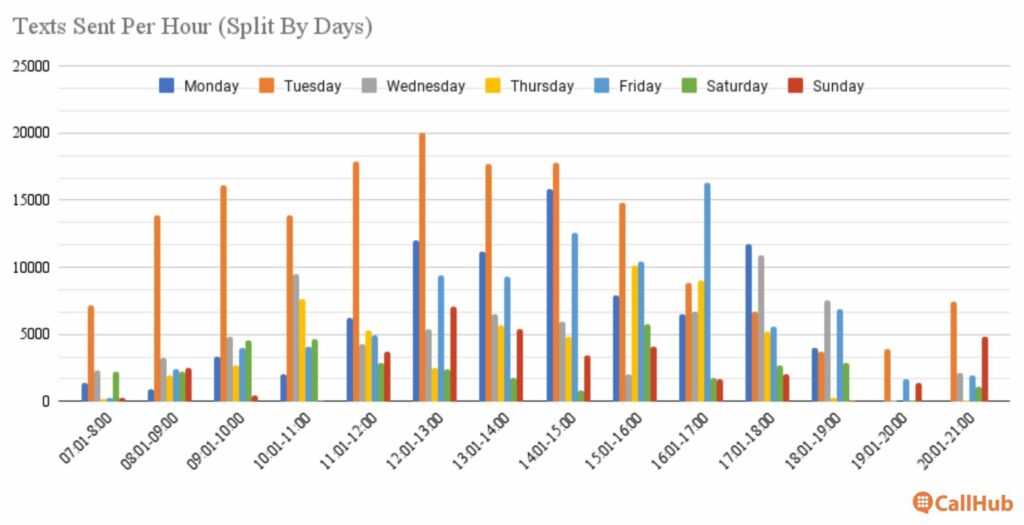
Throughout the week, about 60% of political text blasts are sent around mid-day, between 11 am and 5 pm. 2-3 pm get the highest number of sent texts.
Wednesdays were an exception to this trend, and their highest volume is sent between 5-6 pm.
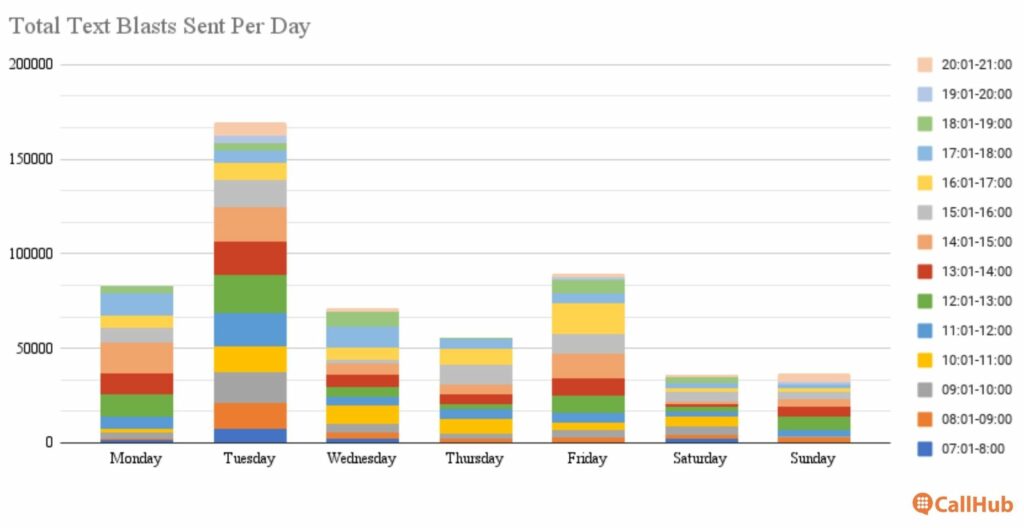
For political text blasts, Tuesdays were the busiest days. Most messages went out on this day (probably to avoid adding Monday blues yet catching supporters before they look forward to a relaxing weekend).
The below graph shows the per-day trends of sent political text blasts to make the comparison more evident.
How do the text blasts reach and how do recipients respond?
Next, let’s look at the delivery rates, responses, and opt-outs compared by the days and hours. Please note that responses and opt-outs can come at any time, irrespective of when your text blast is delivered.
Similarly, if there is a temporary blockage on the recipient’s side, your message will be delivered at a later time. CallHub cannot see why there was a delay. Delivery rates might be skewed due to this reason, but they will still be within the margin of error.
Permanent blockages, like a permanently switched-off phone, invalid numbers, or landline numbers, will also affect delivery rates.
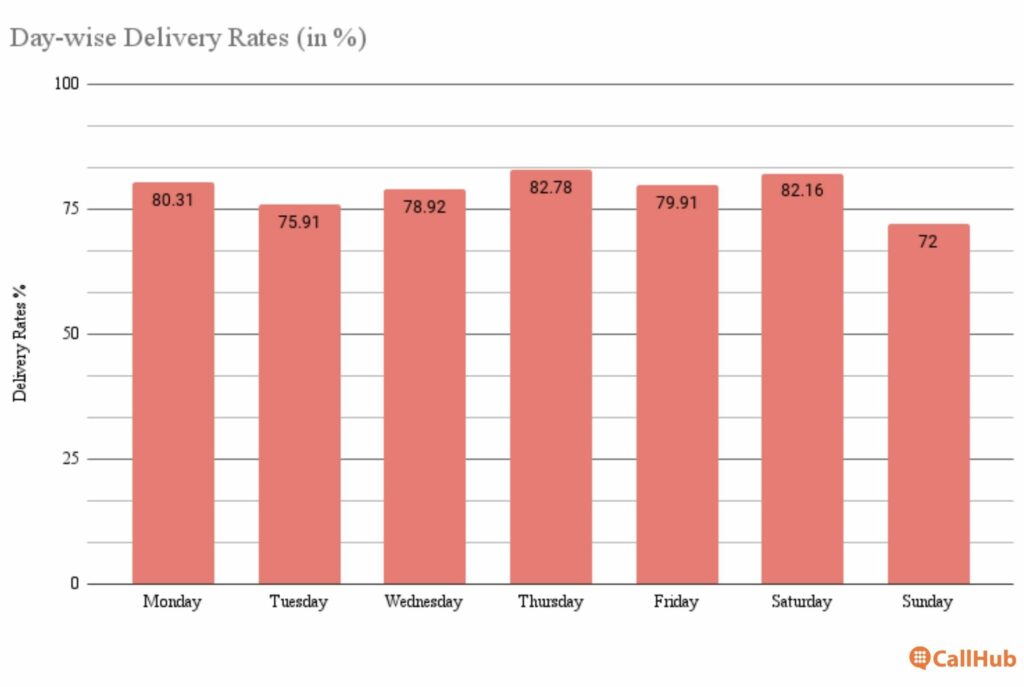
Having these disclaimers in mind, let’s look at the average delivery, response, and opt-out rates per day.
| Delivery Rate (%) | Response Rate (%) | Opt-Out Rate (%) | |
| Monday | 80.31 | 2.74 | 3.60 |
| Tuesday | 75.91 | 1.43 | 4.57 |
| Wednesday | 78.92 | 2.64 | 6.22 |
| Thursday | 82.78 | 1.49 | 5.65 |
| Friday | 79.91 | 2.34 | 6.41 |
| Saturday | 82.16 | 2.51 | 6.62 |
| Sunday | 72 | 2.28 | 7.76 |
The rates show interesting patterns, and while the highest number of messages were sent on Tuesday, the highest delivery rates are on Thursdays and Saturdays. Contacts are most responsive on Mondays and are most likely to opt out of your contact lists on Sundays.
Interestingly, Monday shows an overall positive trend, with the minimum opt-out rate (3.6%), highest response rate (2.74%), and third-highest delivery rate (80.31%).
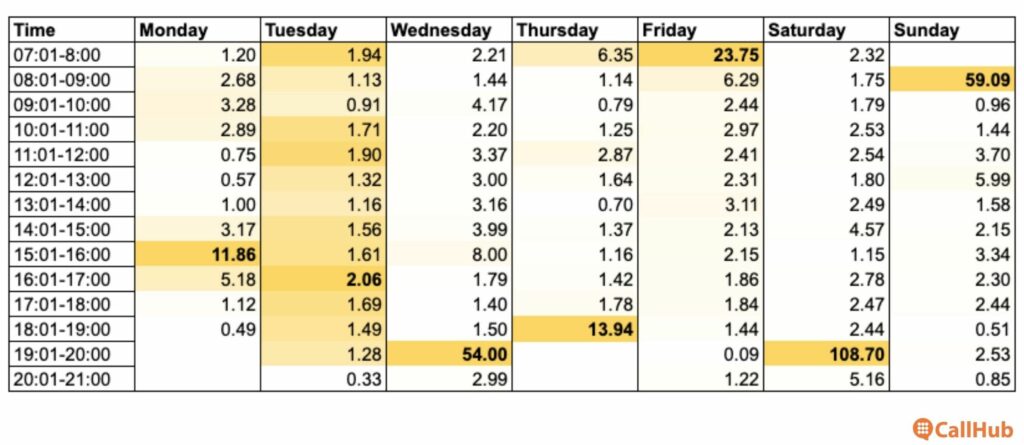
Getting deeper into delivery rates
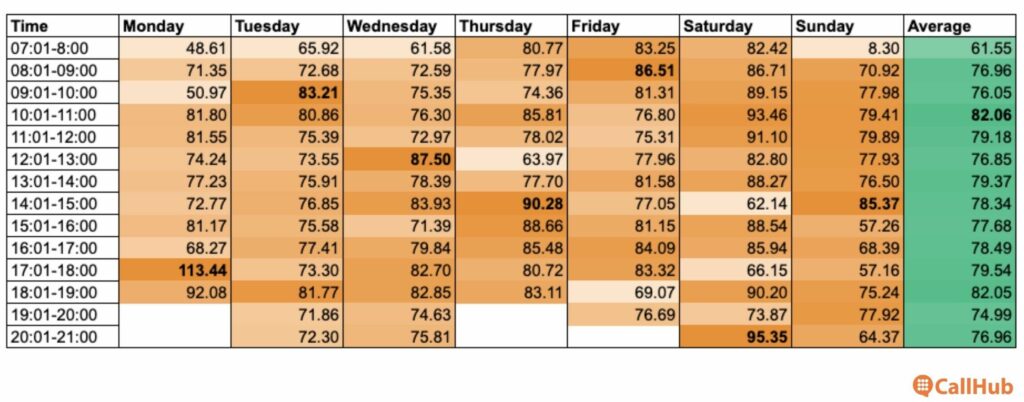
Here’s an hour-by-hour breakdown of delivery rates for political text blasts. Note that we have not considered messages sent beyond TCPA regulated hours.
A reminder that messages can get delivered a few hours after campaigns sent them due to issues beyond the scope of CallHub or carriers. For example, the delivery rate for 5-6 pm on Monday was 113.44%. This was only possible because previous broadcasts got carried over in this hour.
The highest delivery rates were between 10-11 am at 82.06%, followed closely by the 6-7 pm bracket at 82.05%.
For a broader view of the delivery rates, here is the daily average:
Pro-tip: There’s only one way to improve text delivery rates and that is to eliminate invalid and landline numbers from your contact list. Keep a clean, high-quality contact list and see your delivery rates improve substantially.
You may also like: Marie Kondo-ing Your Contact List: How to Clean an Existing Contact List
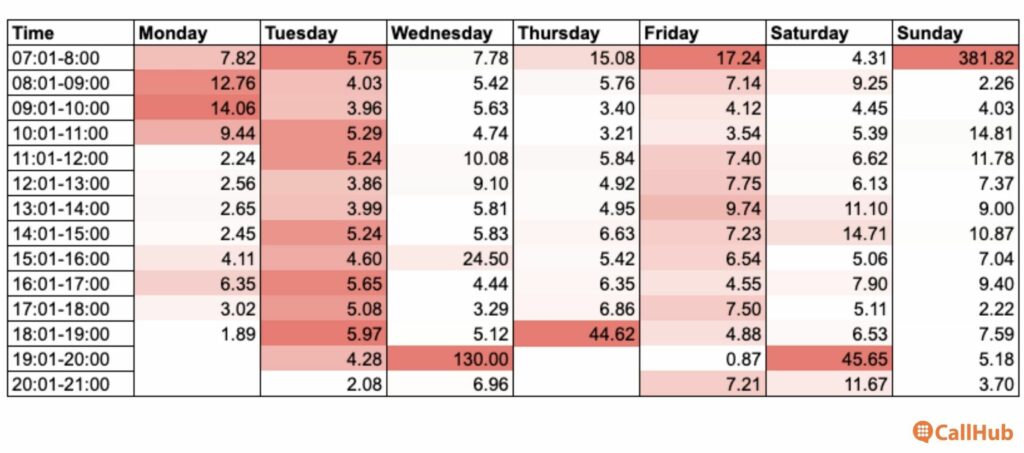
What time are people most responsive?
Reply rates show an interesting trend throughout the week. In most cases, the highest reply rates peak much higher than the median rates.
For example, the Saturday rate of 108.7% between 7-8 pm towers high above the rates of other hours of the same day and above other days. However, the second-highest response rate on the same day is just above 5%– a massive crash from the highest. The second-best performing hour was 8-9 am on Sundays at 59.09%. But similar to the Saturday numbers, the other hours on Sundays showed between 0-6% response rate.
One day shows a stark contrast to such highs and lows. Tuesdays showed the most consistent response rate. On Tuesdays, the highest response rates occurred between 4-5 pm at 2.06%, while the second-best response rate was between 7-8 am, at 1.94%.
Here’s a chart showing the day-wise average response rates:
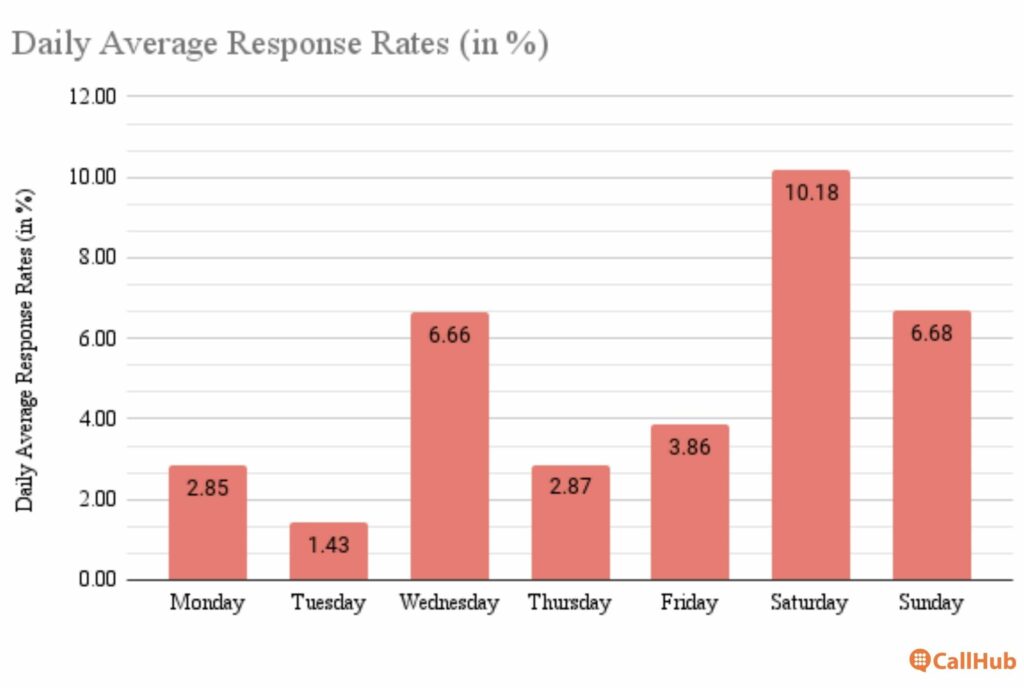
These numbers seem to fall very short of the industry average text response rate of 45%. However, remember that these are text broadcasts and may not always aim to receive replies.
Pro-tip: If your political text blasts aim to get responses, make sure to have agents active when the campaign is running so they can reply. Better yet, invest in a text broadcast tool that can send auto-responses and save data for your next outreach, canvassing, fundraising, or GOTV campaign. Try our political communication tools for free by signing up here.
What time are people more likely to opt out?
The opt-out rates in the heatmap above show the percentage of people requesting a stoppage to text communications. On average, people tended to send opt-out messages early in the morning (7-8 am) and late evening (6-8 pm).
However, the highest number of opt-outs were received at an entirely different time. Most opt-out messages were received on Fridays 2-3 pm and Tuesdays 3-4 pm, respectively. Thanks to a high delivery rate during these time brackets, the opt-out messages didn’t increase the overall rate for that time drastically.
There were other extreme instances when the opt-out rate was beyond 100%. But in such cases, people had opted out irrespective of when the message was delivered, possibly to clean their inboxes. Note that all such instances of the campaigns we studied occurred before 9 am or after 7 pm. Perhaps a good reminder to stay compliant for best results.
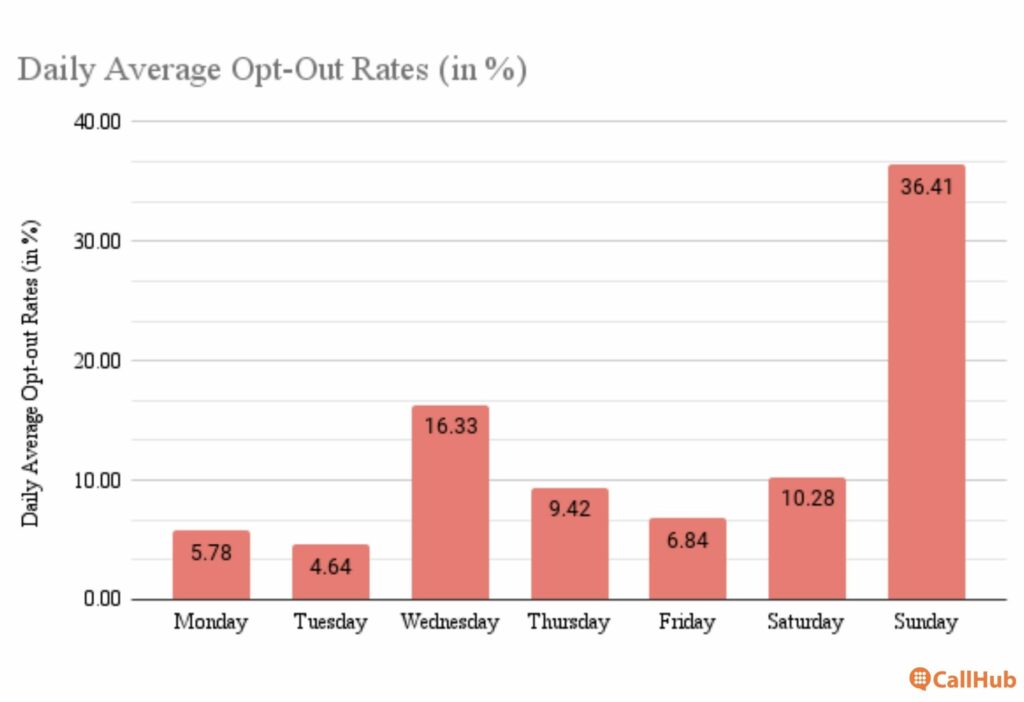
Here’s a broader look at the daily average opt-out rates:
You May Also Like: A Study of 881,000 Texts: Which State Gets the Largest Share of Political Broadcasts?
To Conclude: The best and worst times for political text blasts
CallHub strives for excellence, whether in the texting and calling tools we provide or the best practices we suggest to our readers. As part of that endeavor, we wanted to study the trends of campaigns and offer unique, accurate insights to political campaigns, nonprofits, and businesses.
This article, in particular, looked at hundreds of campaigns that dealt with 780,000 messages. Of course, no one can conclude any trend as the absolute truth. But through rigorous research and study, we can project outcomes to help your texting campaigns perform better.
To conclude, here’s what we saw:
Takeaways:
- The best probability of your message being received is between 10-11 am and 6-7 pm on weekdays. Thursdays have the highest average delivery rates.
- On average, people are most likely to reply to a political text broadcast between 8-9 am and 7-8 pm. Weekends show the highest response rates. Tuesdays get the most consistent reply rates.
- The worst time to send a political text blast is after or before TCPA mandated hours and on weekends (according to both delivery and opt-out rates). Sundays see the highest average opt-out rates at 36.41%. People will most likely opt-out after the TCPA compliant hours of 8 am – 9 pm.
If you have specific topics about political calling or texting that we can research, mail us at [email protected] with the subject line: CallHub Research Ideas.