

The six months between January and June 2021 were busy for political campaigns—although it wasn’t a major election year. They stayed in touch with electorates to retain interest and support.
On CallHub alone, over 881,000 text broadcasts were sent by political customers. These broadcasts, sent across geographies and throughout the day, provide fascinating insights into campaigns’ targeting and strategies.
Previously, we looked at the best and worst timings to send a political text blast. The conclusions showed 8-11 a.m. and 6-8 p.m. to be the most optimum timings.
You can read the full study here: We Analyzed ~800,000 Texts To See What Are The Best & Worst Times For Political Text Blasts.
In this study, we look at the states that get high political text traffic and those that are most responsive to these messages.
TL;DR
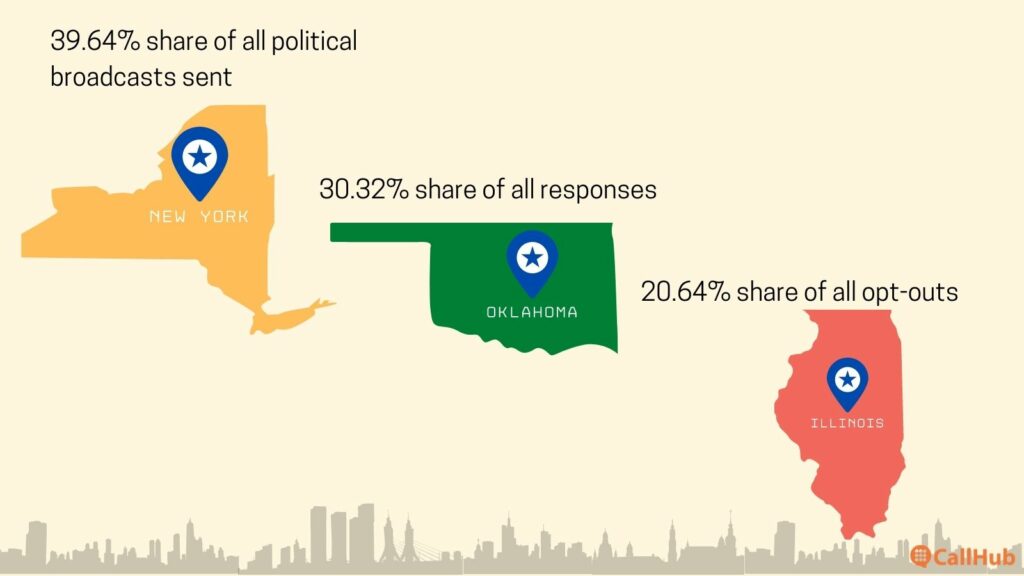
- New York bags the largest slice of the pie—39.64% of all the text broadcasts went to contacts in this state.
- Even with state legislative elections in 2021, Massachusetts, Minnesota, Ohio, Virginia, and Washington received less than 1% of all sent texts.
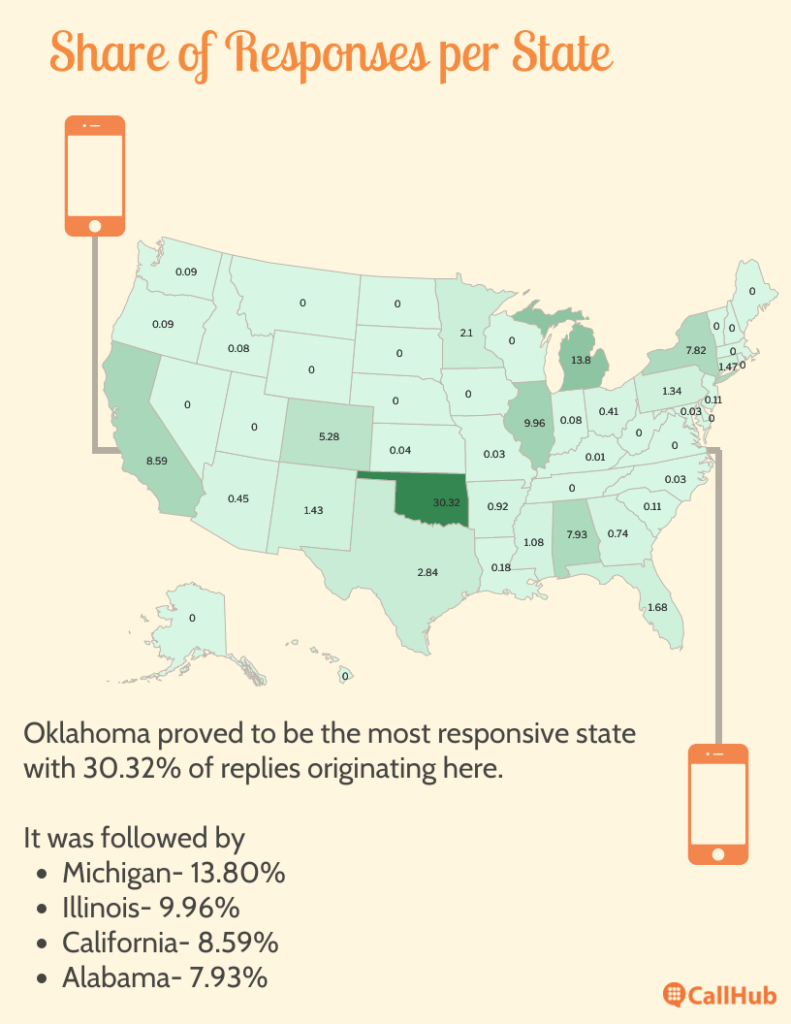
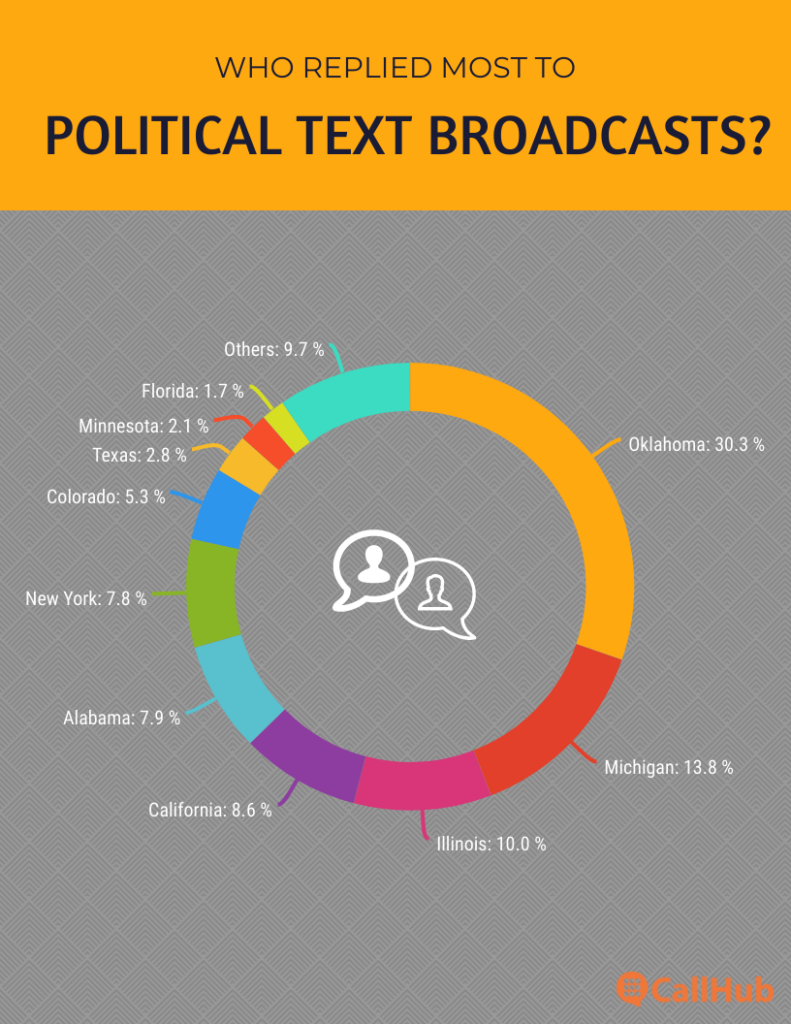
- Oklahoma was the most responsive state, sending a 30.32% share of the total replies.
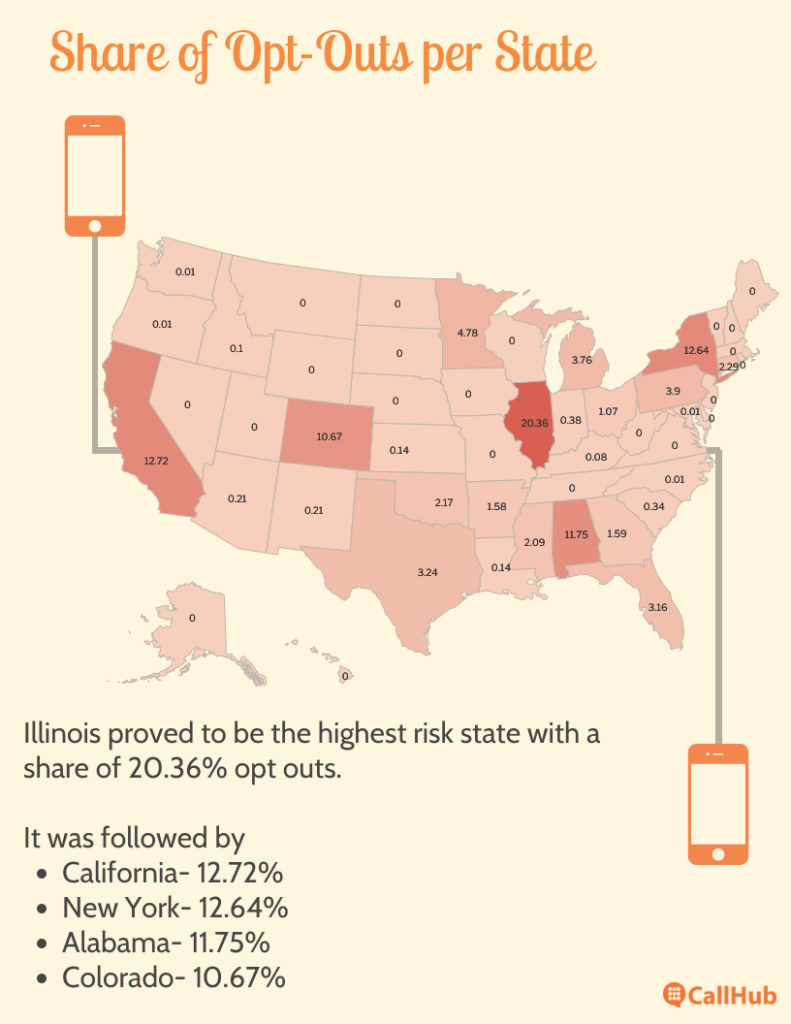
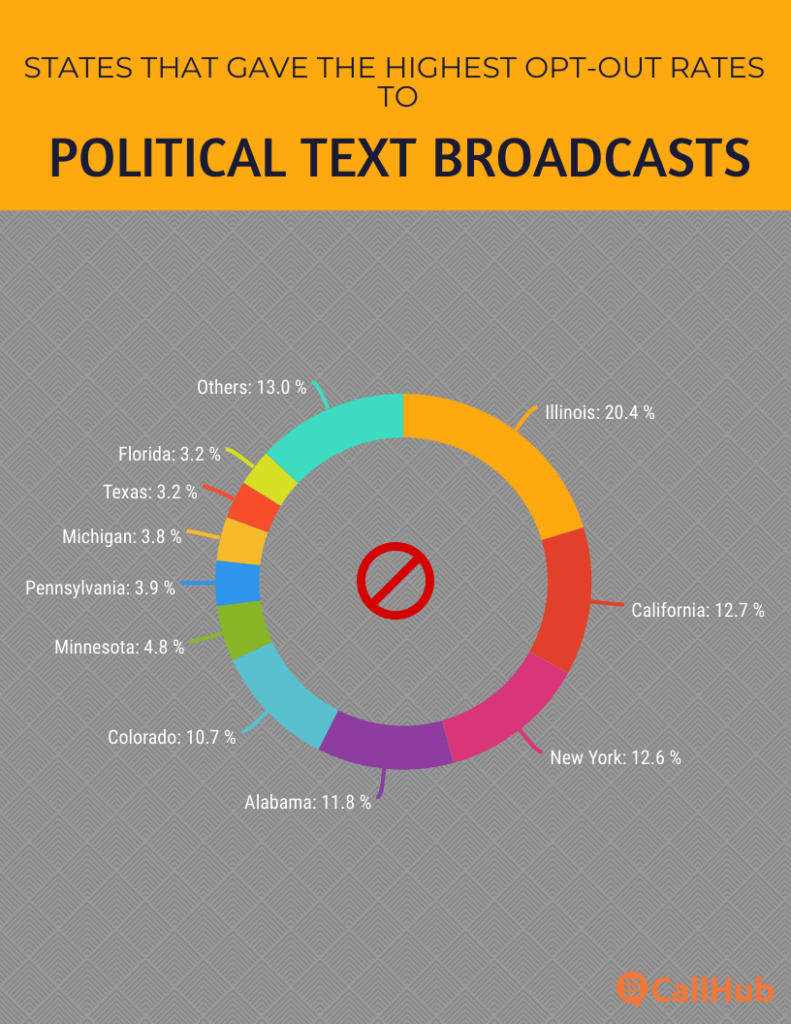
- Illinois, which got the third-largest share of incoming broadcasts, took the top position in opt-out numbers. It accounted for 20.36% of all opt-outs received between January and June 2021.
Disclaimers
- All numbers and trends are true of those campaigns hosted on CallHub between January and June 2021.
- Traffic trends may differ according to the typical supporter level of a state, election levels, and newly acquired information (e.g., target demographics in a particular state and their preference of communication channels).
- We have focused this study on the USA and omitted those sent to area codes in Canada (8.15%) and other territories.
States that got the highest political text broadcasts
2021 hosted off-year gubernatorial elections and state elections in New Jersey and Virginia. Additionally, municipal elections were held in Massachusetts (Boston and Worcester), Minnesota (Minneapolis), New York (New York), Ohio (Cleveland), Texas (Dallas), and Washington (Seattle).
Our study showed that the traffic did not particularly target the election states.
- New York got the most significant share of the text broadcast traffic, followed by Alabama.
- Texas, an election state, received 2.11% of the traffic.
- Massachusetts, Minnesota, Ohio, Virginia, and Washington all got >1% of the traffic share.
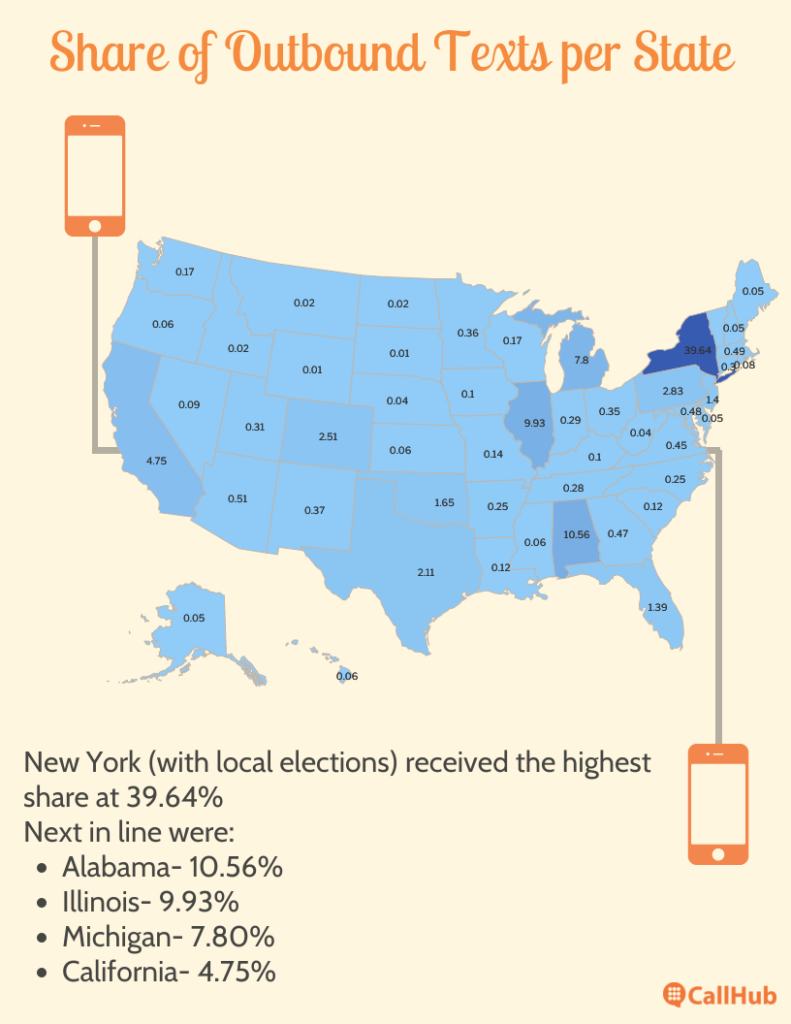
We’re positive that the trends will change in an election year—with a higher volume of texts sent across states. But in 2021, New York, Alabama, and Illinois bagged a 60.13% share of the total political text broadcasts.
Here’s a look at the top 10 and the bottom 10 states regarding the political text blast traffic they received last year.
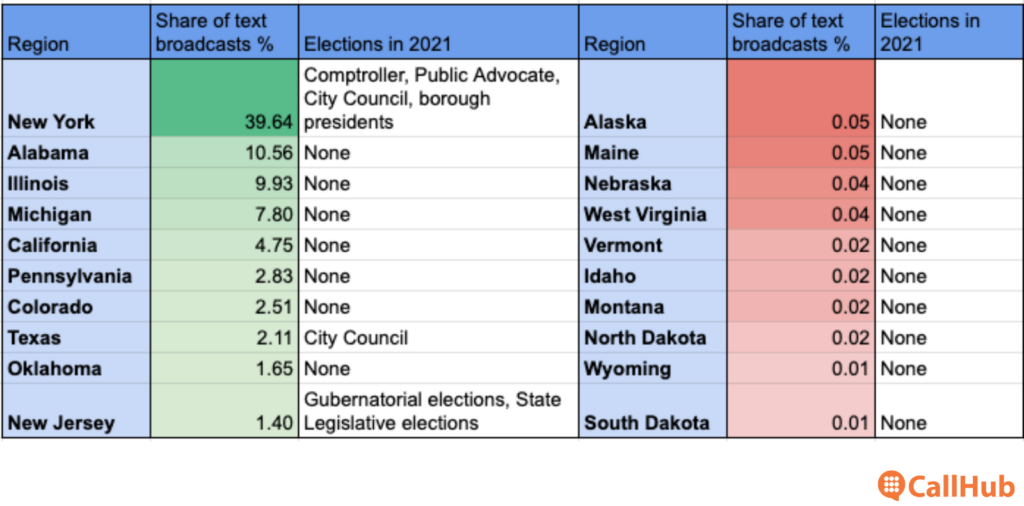
New York received the highest share of political text broadcast traffic at 39.64%. In contrast, the states that followed (Alabama, Illinois, and Michigan) received just 10.56%, 9.93%, and 7.80% of the texts, respectively.
South Dakota and Wyoming received the least share of the broadcast messages—0.01% each, and North Dakota, Montana, Idaho, and Vermont followed with 0.02% of the text traffic.
It was tempting to check the voter share of each state and compare them to the number of text broadcasts they received in 2021. However, we acknowledge the limits of this study. Since we have analyzed only those campaigns hosted on the CallHub platform, the trends seen here do not give the complete picture of the texts received by all electorates from all campaigns.
Having said that, an overview of the voters’ share by state can give you a hint on how you can proportionately divide your resources to target your supporters there. This map by KFF shows the number of registered voters in each state (in thousands).
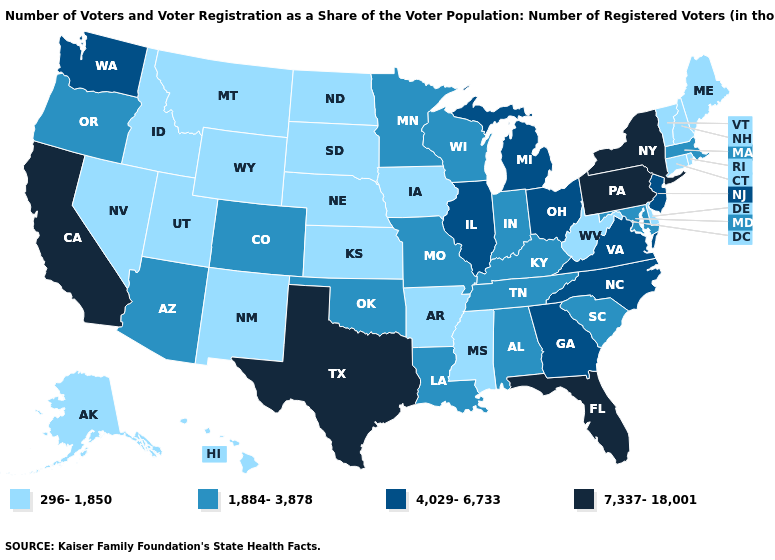
You can use it to plan distributions and rent or validate numbers for your outreach and canvassing efforts.
Best practices for political text broadcasts:
- Aim to distribute and spread your budget and resources proportionate to the registered voters’ population.
- Divide your campaigns by their use cases and distribute them in red and blue neighborhoods/counties/states based on your target audience. For example, fundraising text broadcasts should primarily target areas that have previously supported you. Voter identification campaigns should target swing areas.
- Study delivery rates for your campaigns. Retarget contacts where your texts were left undelivered (or ran into other errors) with phone calls, emails, or other forms of communication.
States that were most responsive to political text blasts
Political text broadcasts typically do not aim for responses. Even if the message includes a question or a prompt, the expected responses are closed-ended. So, a low response rate is not typically an indicator of a poor-performing campaign.
However, a high response rate can confidently indicate a responsive, energetic contact base. We have excluded all responses that requested an opt-out, and we analyze those in the next section.
The insights:
- Oklahoma, which received 1.65% of the total texts, took a 30.32% share of all responses to the political text broadcasts.
- Interestingly, New York, with the highest share of texts, did not make the top 5 in response shares.
- The top 5 states accounted for over 70% of the total responses.
A more accurate way of looking at the response rate is to compare them to the delivery rate (% of messages delivered Vs. sent). The first nine states regarding delivery rates are the same as those that received the highest share of the messages.
Only New Jersey had a lower delivery rate in that sense. Florida, which got the 11th highest share of messages, took over here, and New Jersey ranked 11th in delivery rates.
So irrespective of how we look at it—comparing responses to the total share of messages or delivery rate—the difference in trends of outbound and inbound texts remains constant.
Best practices for better response rates:
- Continue targeting locations that have responded to your broadcasts with text messages. (Non-opt-out) responses are good indicators that this communication channel works well with this audience.
- Analyze the response rates and trends for your campaigns. Target states/regions that actively respond for a more personal, open conversation via peer-to-peer texting.
- Add obvious prompts or closed-ended questions in your broadcast scripts if you aim to receive responses.
States that received the highest share of opt-outs
States that show a high opt-out rate can prove to be risky for your campaigns. High opt-outs mean two things:
- That your message is not welcome.
- You may be breaking TCPA regulations.
From our analysis, Illinois proved to be the highest risk state. It accounted for 20.36% of all opt-outs, followed by California at 12.72%.
Best practices for political text broadcasts:
- Keep a tab on the TCPA guidelines for each state before you schedule the text broadcasts. Texts that reach a person after the regulated time can lead to more opt-outs. Here’s your guide for state-wise TCPA regulations.
- Ensure you have a clean list of contacts who have opted in and consented to your messages.
- Maintain a regular flow of texts but don’t overdo it. You can achieve this by analyzing previous campaigns and studying patterns or asking your contacts how frequently/for what purpose they would like to receive your messages.
Conclusion
CallHub strives for excellence, whether in the texting and calling tools we provide or the best practices we suggest to our readers. As part of that endeavor, we wanted to study the trends of campaigns and offer unique, accurate insights to political campaigns, nonprofits, and businesses.
This article, in particular, looked at hundreds of campaigns that dealt with 960,000 messages. Of course, no one can conclude any trend as the absolute truth. But through rigorous research and study, we can project outcomes to help your texting campaigns perform better.
Feature image source: Nico Smit/Unsplash.