

Table of Contents
Whether you’re running a phone bank, a fundraising drive, or a voter contact campaign, you need to know what’s working before you run it again. CallHub’s Advanced Analytics gives you a single view across calls, texts, and voice broadcasts: who answered, who opted out, which agents are converting, and where your campaign is losing contacts in the funnel.
Here’s what you can track, what the numbers actually tell you, and how to use them to improve your next campaign.
Campaign performance reporting is your best bet for when you want to know answers to questions like, “What are my chances of succeeding this time?”
Let’s explore CallHub’s Advanced Analytics and understand how the insights it generates are crucial to your campaign.
| What you’ll learn in this guide: 1. The three analytics dashboards in CallHub (Call Center, Texting, Voice Broadcasts) 2. The key metrics that tell you if your campaign is reaching real people 3. How to identify underperforming agents and timing gaps 4. How to read conversion funnels and act on them |
Why outreach teams need advanced analytics
Data isn’t just numbers and charts on a screen. It is a diagnosis that tells you what’s wrong, what can be improved, and what is working well. Advanced analytics enable organizations to:
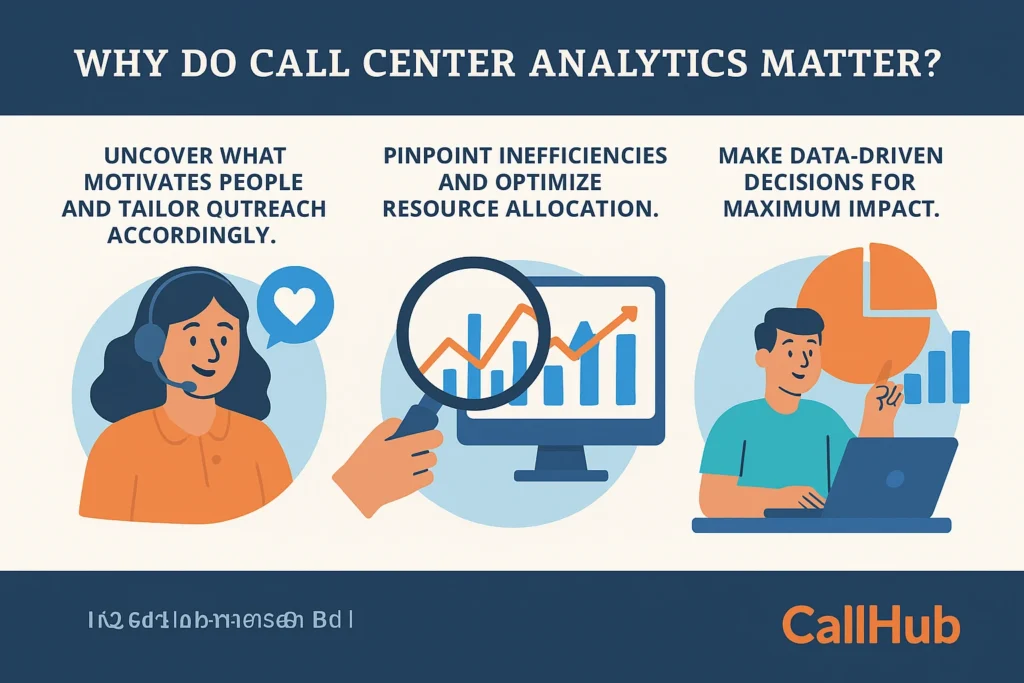
- Understand behavior: Uncover what motivates supporters, buyers, and voters, and tailor outreach accordingly.
- Pinpoint inefficiencies: Reduce wait times, make better pitches, improve agent training, and optimize resource allocation.
- Make data-driven decisions: Identify best practices and refine scripts or approaches for maximum impact.
In other words, analytics turn everyday outreach into insight-driven action. For example, with the right insights, you can:
- Track conversion rates: Tracks that approach, offer, or script translate into actual sales, donations, or votes.
- Score leads: Identifies and prioritizes contacts most likely to convert, ensuring valuable resources focus on where they deliver the highest return.
- Improve agent performance: Identifies top performers and areas that need additional training, enabling targeted coaching to fuel ongoing improvement.
Whether the goal is to achieve higher sales, increase donations, persuade more voters, or scale up a membership drive, advanced analytics turn every conversation into a measurable advantage
Let’s take a look at what CallHub has to offer so you know how to leverage insights.
What you can track with CallHub’s Advanced Analytics
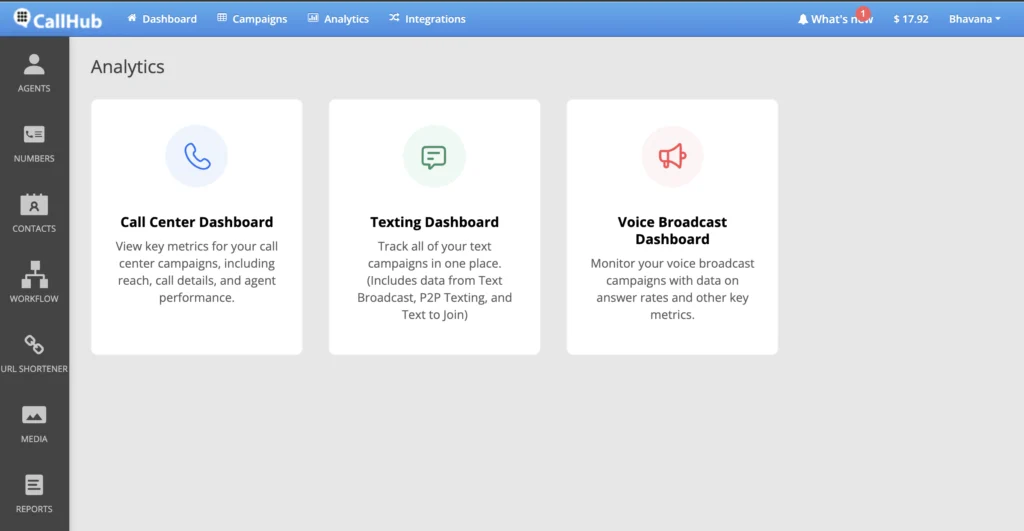
CallHub’s Advanced Analytics is divided into three sections:
- Call Center
- Texting
- Voice Broadcasts.
You can split your analytics by the type of outreach you are engaging in.
You can see all the calls you made, all the texts you sent, and all the voice broadcasts sent out for say a day, a week, a month, or even a year. Beyond that overview, you can also choose individual campaigns or agents to get an instant, in-depth look.
| Bonus: CallHub lets you create custom dashboards, so you can view the information most relevant to you upfront. Plus, don’t forget to export the details you wish in any format that works for you. |
Here are all the analytics you can track with CallHub at a glance (we will take a look at them in detail below)
Call center analytics:
With CallHub’s call center analytics, you can understand:
- How well your calls are performing,
- What impact they are having, and
- Whether you need to refine your scripts or your calling list.
Call center analytics is CallHub’s most in-depth insights section.
Here you can get answers to questions like:
- How long are contacts speaking to my agents?
- Is my contact list ‘good’, i.e., reaching a lot of real people, or are most of my calls going to answering machines, bots, or, worse, wrong numbers?
- How many people are opting out of my communication? Are my calls contributing to the increase in opt-outs?
- How many people want follow-up texts after receiving a call from you?
- How many people send you inbound texts (RSVP, survey answers, etc.) once you call them?
You can also get a deep dive into your agents’ (or teams’) performance. You can measure this by tracking factors such as the number of calls made, the duration of each call, and so on. This is where advanced analytics becomes especially useful for campaign managers
Advanced analytics for texting:
With texting analytics, discover:
- How many texts are you sending?
- Costs for these campaigns
- How many responses are you getting, and
- The ratios of inbound vs outbound texts.
Here, you can measure the impact of your texting campaigns through metrics like:
- At what hours of the day do you get the most responses to your texts?
- How many replies did you get compared to the texts you have sent?
- How many of your texts were delivered?
- Did many people opt out of receiving your texts?
Similar to calls, you can get an overall view of the performance and cost of your texts across a selected period, or drill down and see the metrics of each campaign you ran, and even cross-reference that with individual agents to find out the superstars in your team.
| Remember: You can use this dashboard to view metrics for all texting campaigns—Text Broadcast, Peer-to-Peer texting, and Text to Join. |
Advanced analytics for voice broadcasts
Voice Broadcast campaigns have two critical factors they hinge on:
- How many people heard your broadcast, and (if applicable),
- Did they press a digit to take further action?
Not only does CallHub’s analytics measure these two, but it also provides you with helpful graphs to get an overall picture of how your voice broadcast campaigns are doing.
At a glance, you can tell:
- Are people listening to voice broadcasts, or cutting the call after a few seconds?
- How many ‘answered’ voice broadcasts were heard by a real person?
- How many voice broadcasts does it take to get a certain number of conversions?
- What is all of this costing?
Now that you have a general idea about what you can track with Analytics, let’s have a look at how teams can leverage the different analytics CallHub offers.
How teams use these insights
While CallHub offers far more analytics than mentioned here, let’s take a look at just one: the Call Center Dashboard. This will show you how advanced analytics answers specific questions through numbers and helps boost campaign effectiveness over time.
What we shall do in this section is:
- Have a look at a section in Call Center Analytics
- Understand what some of these numbers mean and what they tell you
- What kind of changes should you implement to make your calling campaigns better
We will examine several analytics sections, all of which can be accessed through your CallHub account.
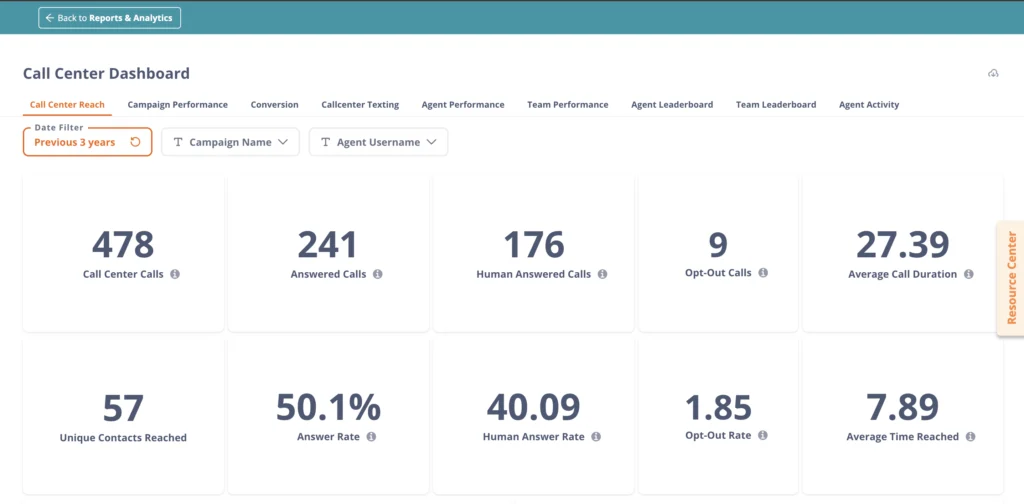
Call Center Reach
- Human answered calls – Total calls answered by a person. You need this number to determine if too many of your calls are being blocked, going to voicemail, or answered by AI assistants. Your goal is to increase this number. Otherwise, your calls are costing you money but achieving nothing.
- Opt-out calls – Number of people who chose to opt out of your contact list after receiving the call. Too many opt-outs means people are actively disliking your calls, which is a strong no-no.
- Average time reached – The number of times the campaign called each contact. Studies show that calling someone twice is good for conversion. However, if you have to call every person three times or more, then perhaps you need to reconsider your outreach frequency and effectiveness.
You can see more details through graphs. For example:
Calls over time – This displays the number of calls made each day during a selected period. It helps you understand when the campaign was most productive.
You can even see the breakdown of calls made every day of the selected period, with details such as:
- The number of calls made,
- The duration of each call on each day, and
- The number of unique phone numbers reached.
Campaign performance
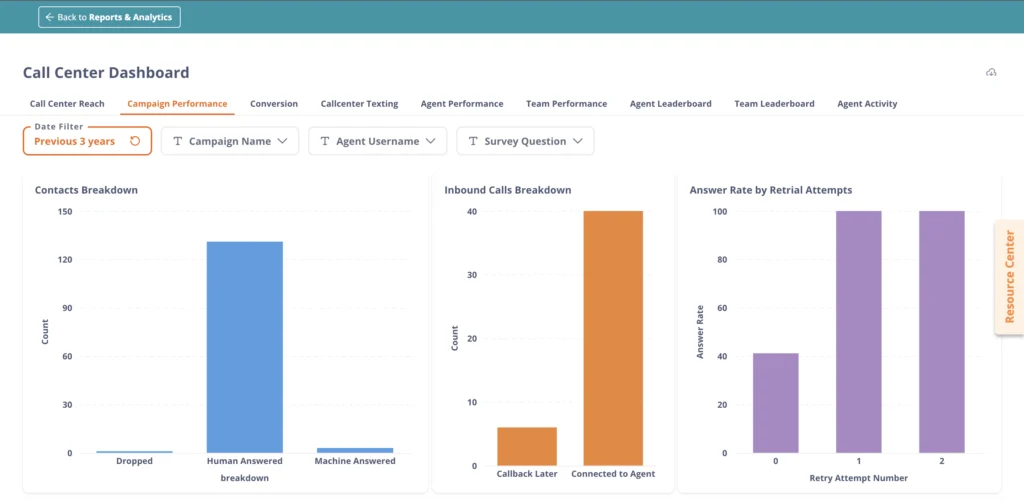
- Inbound calls breakdown – See how many calls made to your campaign were answered by your agents, and how many callbacks they skipped. This is critical if you are trying to answer questions for people.
- Answer rate by retrial attempts – How many calls does the campaign make before speaking to a person? Hint: If there are too many retrials, there may be something wrong with your number or the timing of your calls.
You can even view answers to your surveys, as well as the dispositions your calls have been assigned by agents.
Conversion

- Call conversion funnel – What percentage of your calls convert into a desired metric? You can choose upto three metrics you want to see the funnel for via the ‘Funnel Status’ drop.
Additionally, by picking an agent from your team as a filter, you can even see how effective any particular agent is at converting calls into specific metrics. Perhaps some are suitable for sign-ups, while others are better suited for donations, and so on.
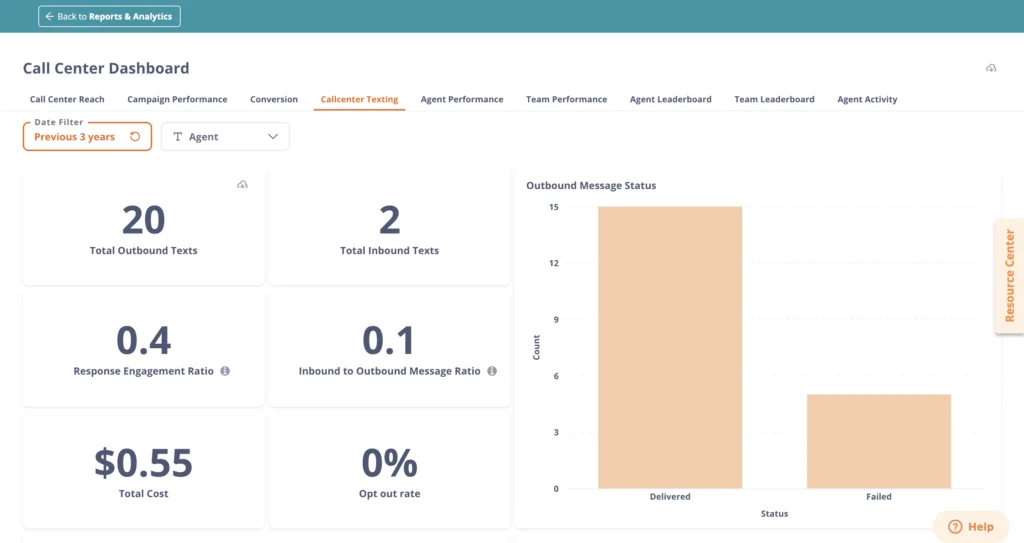
Call Center Texting
Response engagement ratio – How many texts you have received from a ‘unique’ contact, compared to the number of texts you have sent out to ‘unique’ contacts. This does not count multiple texts sent and received from the same person.
Inbound to outbound message ratio – Overall, how many texts are you receiving in comparison to all the texts you have sent out? Your team may be sending out far too many texts and barely getting any replies.
Inbound to outbound SMS ratio (over time): Divided into hours and weeks, this helps you see the best day and the best time during the day for text replies. Enables you to understand when your audience is most likely to reply.
Agent/team performance
These sections let you see how your agents and teams are performing, identify areas for improvement, and pinpoint pain points to address.
Average session duration – How long it takes your agents to go from one call to the next. Agents may be spending too much time filling in details and connecting to another call. Agents may not be spending enough time updating sheets. You can pick the session duration that fully optimizes your goals while maximizing the agent’s time, and train agents to meet it.
Average call duration – How long are agents speaking to contacts? Once again – could be too long. It could be too short. You need to consider the number of conversions you’ve achieved and compare them to the numbers here to determine the most efficient timelines for your agents.
Average wrap time – Once a call is completed, how long does it take an agent to fill in the details you want them to complete? You may be asking them to fill up too many sheets. Or they may be taking too long to fill in three sheets. This number will have the answers.
Furthermore, these sections illustrate how top performers are performing and their corresponding conversion rates. This will help you motivate others to meet their numbers.
These are some advanced analytics metrics you can use to significantly improve your calling game. Similar gains can be made in the texting and voice broadcast analytics section. The goal here is to use numbers to make decisions, thereby improving efficiency.
How to access advanced analytics on CallHub
So far, we have answered:
- Why campaigns need analytics,
- the kinds of analytics CallHub offers and
- Given you a sample of the questions you can have answered by scanning through one of the analytic sections Callhub offers.
The only thing left to do now is to load your CallHub account and review your advanced analytics dashboad.
Don’t have a CallHub account? You can sign up for one right here.
Once you have an account or log in, here’s what you need to do –
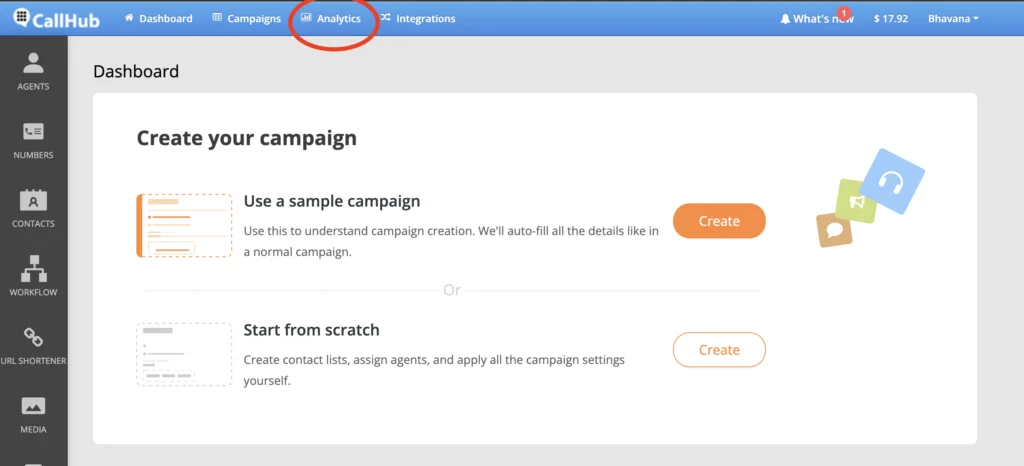
- Log in to your CallHub account at the home page.
- In the top center, you will see the option to access analytics.
- Choose which kind of analytics you wish to see – calling, texts, or voice broadcasts.
And you’re all set. Please get in touch with CallHub support for any questions or to access more detailed analytics.
FAQs on advanced analytics
What is advanced analytics in outreach campaigns?
Advanced analytics in outreach campaigns refers to the use of sophisticated data analysis tools and techniques—such as predictive modeling, segmentation, and real-time dashboards—to measure, optimize, and improve campaign performance. These tools help organizations understand supporter behavior, identify trends, and make data-driven decisions for better results.
What are the key metrics to track with advanced analytics tools?
Key metrics include conversion rates, response rates, opt-out rates, agent performance, cost per contact, and engagement ratios (such as inbound vs. outbound messages). Tracking these metrics helps organizations refine their outreach strategies and maximize impact.
How does an advanced analytics strategy differ from basic reporting?
An advanced analytics strategy goes beyond basic reporting by leveraging AI, machine learning, and custom dashboards to uncover deeper insights. It enables organizations to forecast outcomes, segment audiences, and personalize outreach, rather than just tracking historical performance.
Are there any benefits of using AI-driven analytics in call centers?
AI-driven analytics can improve agent performance, reduce wait times, and optimize resource allocation. By analyzing call data in real time, AI can recommend script adjustments, identify top-performing agents, and automate routine tasks, freeing up staff for higher-value work.
How can organizations get started with advanced analytics for outreach?
Start by defining clear campaign goals and identifying the most important metrics. Choose an analytics platform like CallHub that offers customizable dashboards, AI-powered insights, and integration with your outreach tools. Train your team to interpret data and act on insights for continuous improvement.