

Table of Contents
8% of donors stop giving because of a lack of information on how their gift was used.
Donors want to know:
- How their money is being used
- What kind of impact their support is creating
Often, simply answering these questions is more important for donors than achieving impossible goals with their funding. Being transparent with your donors will help you build a community of supporters that will stick with you for the long run.
And that is what an impact report will help you do. Let’s go through how you can put a nonprofit impact report together with:
- The essential elements of a report
- Best practices to convey impact
- Examples of reports
What is a nonprofit impact report?
Your organization’s impact report details the change brought about by your campaigns in the form of data and testimonials, and how funding by supporters and major donors like foundations (the target audience of your report) has driven that change.
An effective nonprofit impact report achieves the following things:
- Highlights the beneficiary of the campaign/s
- Describes the methods used to collect data
- Uses a framework to construct the report (ex. SDG)
- Discusses negatives as well as positives
- Targeted towards the intended audience (Focus on beneficiary stories for individual donors, Fund allocation for grant making foundations)
Impact reports can go by other names, such as annual reports or community reports, but they are all essentially one and the same.
Explore: Nonprofit Annual Report: An Insider’s Guide
How to build a nonprofit impact report
Setting impact goals
Setting impact goals well in advance will help you gather data and relate it back to the impact you are creating.
The lack of a framework often leads to impact reports that provide no real insight into how donations and volunteering have contributed to the impact your campaigns are creating. That means you cannot give supporters the transparency they are looking for to foster continued support.
A good way to chart your goals is by using the Theory of Change framework.
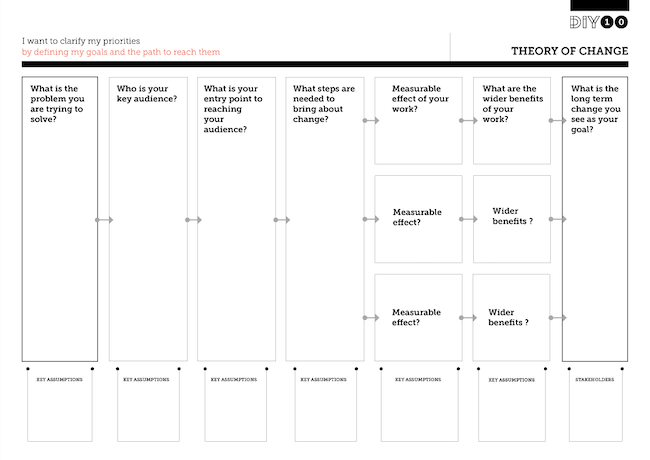
Here’s a summary of how you can use the TOC model to inform your impact reporting.
Data collection for your nonprofit impact report
There are a number of ways to collect data for your impact report.
Internal data (data on the allocation and spending of funds) is often tracked on an organization’s CRM, or through spreadsheets. (If using spreadsheets, all your data will exist in silos, thereby making it harder to consolidate them for your report).
Feedback data from beneficiaries (especially in rural areas) is often obtained through offline tools (pen and paper).
Data from volunteers and staff can be obtained through apps, or SMS surveys.
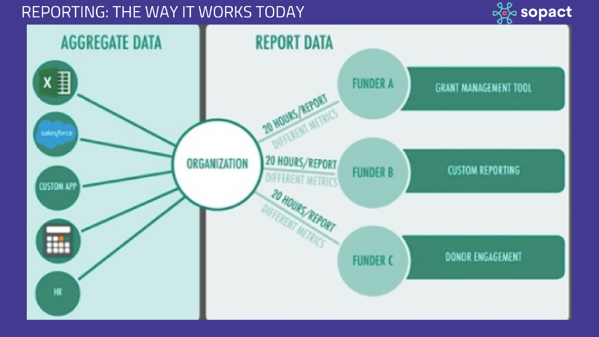
While obtaining the data you need can be a fairly straightforward process if you have a CRM/ Database tool, consolidating that data into your impact report in the form of a narrative is the real challenge.
This is where the initial framework you create will come in handy, allowing you to align metrics and create an impact story based on insights from beneficiaries and real outcomes.
UNICEF offers a great in depth guide on data collection and analysis methods for your impact report
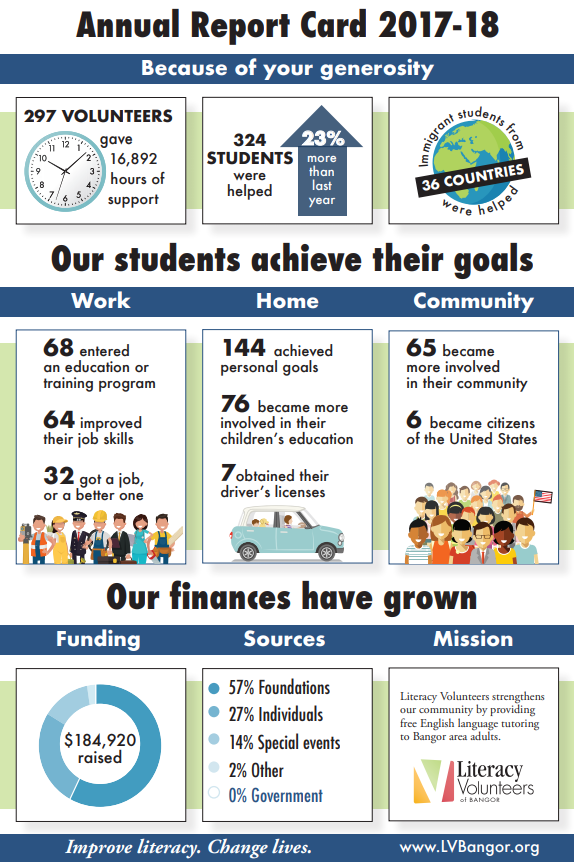
Elements of your report
What should be included in an impact report?
Based on your initial framework, the elements of your impact report may differ, but the general idea is this:
Your organization, mission, and vision
Start by letting the reader quickly make the mental connection between the report and your organization.
Your mission, values and vision will help the audience relate to your organization and give them a reason to care about the impact that you are going to lay out further in your report.
Leaders and beneficiaries
Add a human element to your impact report by highlighting the key leaders and staff of your campaigns. You can add a short bio for each person, expanding on their role responsibilities in your organization/campaign.
Similarly, you will want to highlight beneficiary stories in your report. While numbers can offer a broader insight into the successes of your campaigns, hearing from the people impacted by your efforts will add emotional weight for your audience.
Your financial report
Your financial reports answer the questions:
- Where is your organization getting funding from? (individual donors, grants, etc.)
- Where are those funds being allocated? (overhead, events, direct to beneficiary)
- Were there any budget changes that took place?
Your campaigns
Give an overview of your organization’s major projects in the period between the last report and the current one.
Talk about:
- Activities that happened in the time period
- Broad goals that have been achieved
- Timelines for completing future work
Impact data
This is where you demonstrate the successes of your campaigns in numbers.
Ex. Our campaign provided food and shelter for 532 homeless people in the month of December, an increase of over 50% from last year.
Among other data, you could show:
- Beneficiary satisfaction levels
- Funds received and successfully allocated
- Percentage of goal completion
A final call to action
Besides showing donors tangible impact, the other objective of a nonprofit impact report is to sustain long term supporter relationships.
Finish by thanking donors for their continued support, and giving them ways to keep being involved with your organization. Ex. Volunteering at events, signing up for recurring giving, setting up a peer-to-peer fundraiser.
Best practices
Follow these best practices to help you create a more compelling impact report.
Using Illustrations for visual interest
Images are often powerful in that they can grab a reader’s attention as they look through a page.
Break up the paragraphs in your report with illustrations that add value (or are simply relevant)
Here’s an example from charity:water.

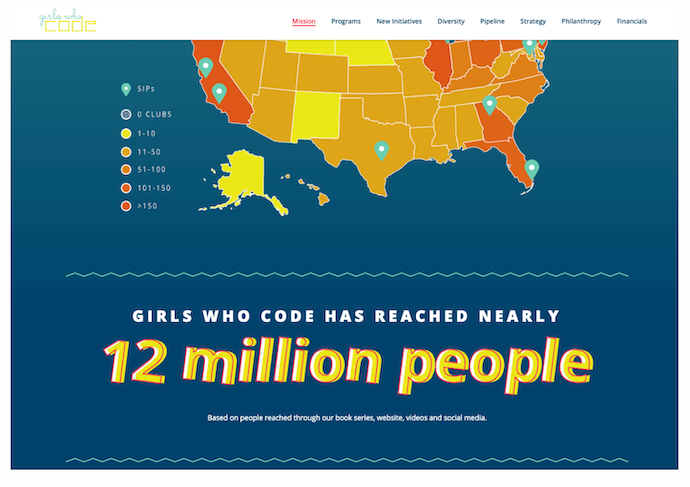
Graphs to highlight stats
Numbers are great, but the human brain processes information better when it is presented in a more visual medium.
Good data visualization should let you:
- Tell a story using data
- Highlight useful information
- And drown out the noise from data
Here’s an example from Girls Who Code, showing the audience how many people they have impacted in the form of a map.
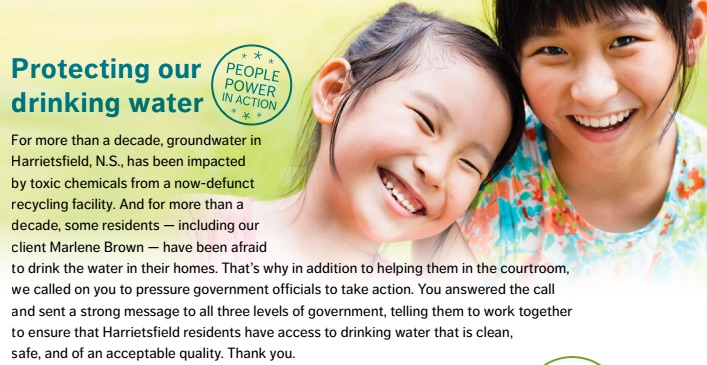
Demonstrate your impact on real people with testimonials
Conduct interviews with beneficiaries and let them talk about the impact a campaign has had on them in their own words. Pictures let readers attach a face to the story.
Be honest – highlight the negatives and positives
An impact report with only successes can start alarm bells in the minds of your audience. As we mentioned earlier, simply being honest and transparent is more important for your supporters than showing them how much of an impact you have made.
Keep it concise
An impact report is a large undertaking for an organization, so it is natural that there is going to be a lot of information presented in your impact report. Making it easier for your audience to see the impact your organization has created involves being brief and concise wherever you can.
But that is not always going to be possible. You will need to look beyond your report to find ways to communicate impact to supporters, which brings us to our next point.
Repurposing your impact report for other channels
Once you have your impact report ready, all that is left is to gather the attention of supporters. As much as they desire to see the impact that your organization has achieved, they may not have the time to sift through your report to get the information they need.
Showcase the insights from your report by:
- Highlighting specific statistics and graphics in social media posts.
- Sending text messages to supporters with beneficiary quotes.
- Highlighting your projects in email campaigns (newsletters or appeals).
Those are just some ways to get impact across to your support base in a way that is easy to consume.