





Table of Contents
At 2 p.m. on election day, a campaign dashboard can look busy without being useful. Thousands of calls have gone out. Texts are marked delivered. Volunteers are still logging shifts. Yet the campaign manager has one urgent question: Are we removing the barriers that keep our voters from casting a ballot?
That is the purpose of GOTV metrics. They turn outreach activity into decisions. They show where voters are dropping out of the process, which channels are producing meaningful contact, whether volunteer capacity is being used well, and where the next hour of effort should go.
The distinction matters. A high attempt count may signal hard work, but it does not prove reach. A high contact rate may show strong conversations, but it does not prove the program caused turnout. Good GOTV reporting keeps these claims separate.
This guide explains what to measure before, during, and after the final push, building on the fundamentals in CallHub’s complete guide to GOTV. It also shows how to calculate each core rate, compare channels fairly, and estimate turnout lift without overstating what the data can prove.
What GOTV effectiveness means
GOTV effectiveness has three layers:
- Operational effectiveness: Did the campaign execute the planned calls, texts, canvass shifts, and volunteer assignments?
- Contact effectiveness: Did those attempts reach the intended voters and produce useful conversations, voting plans, or resolved barriers?
- Electoral effectiveness: Did the program increase validated turnout compared with what would probably have happened without it?
Campaigns need all three. Operational metrics identify execution problems while there is still time to fix them. Contact metrics show whether the outreach is moving voters toward a concrete plan. Electoral metrics help evaluate impact after official voting records become available.
Do not collapse these layers into one score. A channel can be fast but shallow, expensive but productive, or effective with a narrow voter segment. The useful question is not “Which channel won?” It is “Which channel moved this audience through the next step at an acceptable cost?”
Build a GOTV measurement funnel
The cleanest way to organize GOTV analytics is as a funnel. Every stage has a defined population, and every rate has a written numerator and denominator.
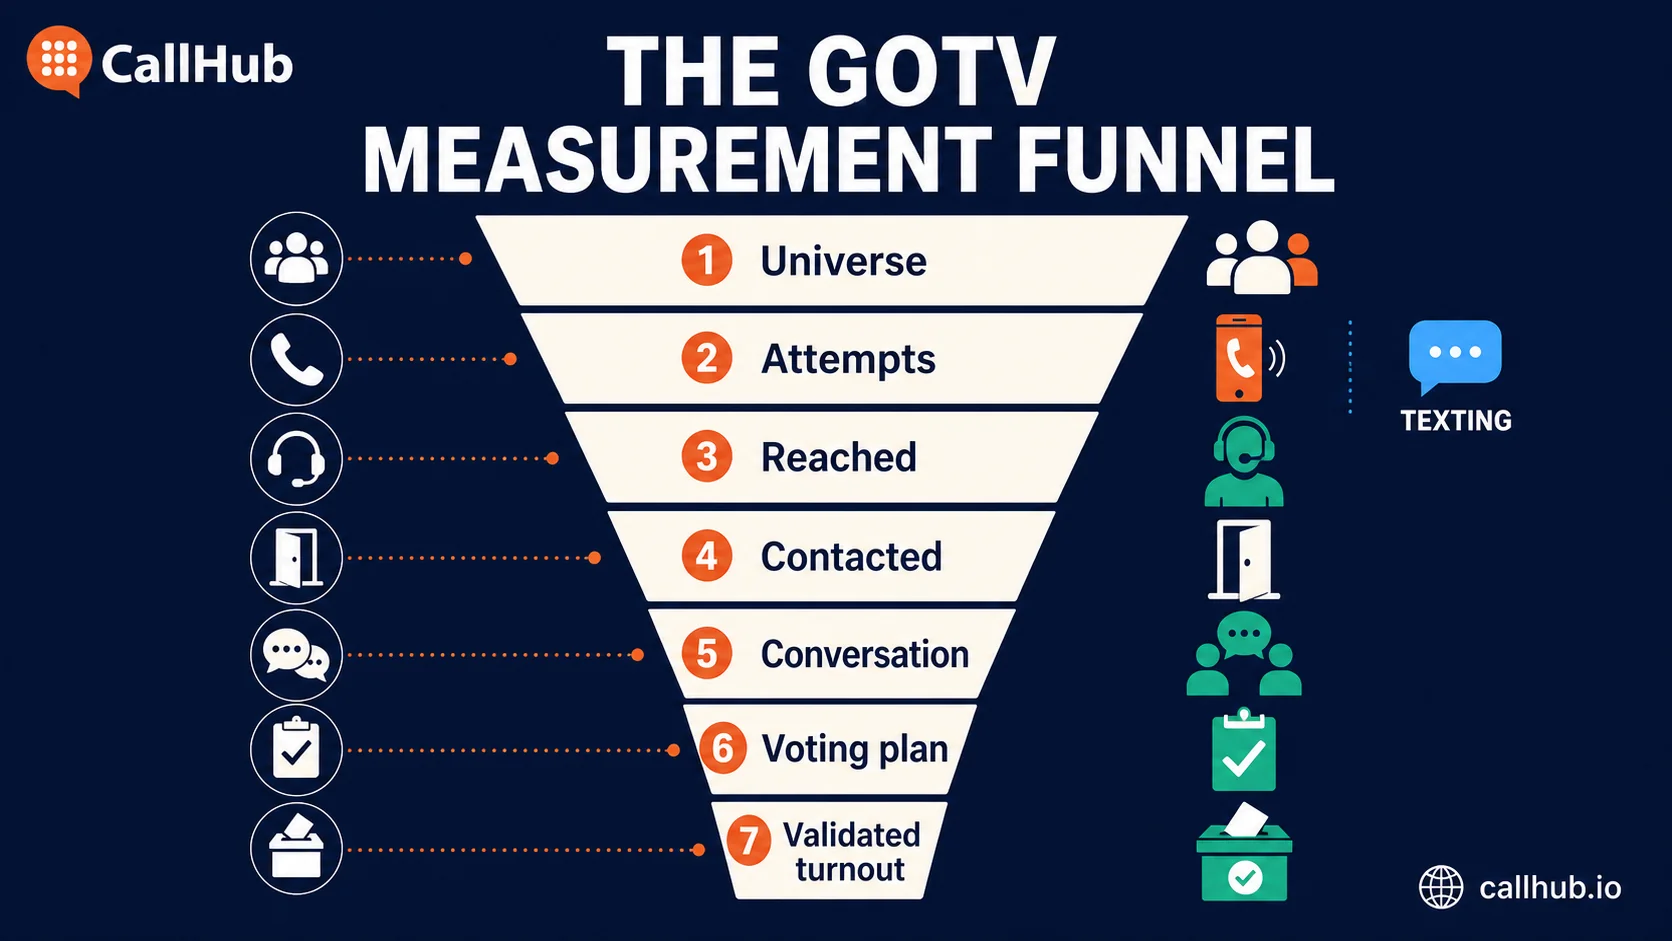
| Funnel stage | What it records | Common failure to avoid |
|---|---|---|
| Universe | Unique voters selected for GOTV outreach | Mixing persuasion targets with mobilization targets |
| Attempts | Calls, texts, knocks, or relational touches initiated | Treating attempts as unique people |
| Delivered or reached | Attempts that reached a working device or address | Comparing channel delivery definitions as if they are identical |
| Contacted | A voter or appropriate household member responded | Counting voicemail, unanswered texts, or literature drops as contact |
| Meaningful conversation | The interaction captured usable voting information | Letting each volunteer decide what “meaningful” means |
| Voting plan or barrier resolution | The voter identified when, where, or how they will vote, or received help with a barrier | Recording a promise without the plan details |
| Validated turnout | The voter was matched to an official post-election voting record | Treating self-reported voting as final validation |
Write the definitions before the first shift. For example, a phone contact might require a live conversation with the target voter. A text contact might require an inbound reply from the voter. A canvass contact might include a qualified household member, but the dashboard should distinguish that from a direct voter contact.
If definitions change midway through the program, add a timestamp and preserve the old definition. Otherwise, a jump in performance may only reflect a reporting change.
GOTV metrics every campaign should track
The following metrics form a practical scorecard. Not every campaign needs every cut of the data on its main dashboard, but the underlying records should support them.
Attempt volume and unique reach
Attempt volume is the total number of outreach actions initiated. It is useful for checking execution against the plan.
Unique reach is the number of distinct voters who received at least one deliverable attempt.
Unique reach rate = unique voters reached ÷ total voters in the assigned universe × 100
Track both. Ten attempts to the same voter are ten attempts but only one person reached. Without voter-level deduplication, a busy multi-channel program can look larger than it is.
Delivery rate
Delivery rate = delivered attempts ÷ total attempts × 100
Use channel-specific delivery definitions. For texting, delivery may come from carrier status. For phone, a connected call does not always equal a live person. For canvassing, a valid address is different from an answered door.
Delivery failures are a data-quality signal. A high rate of invalid numbers or addresses should trigger list cleaning, alternate-channel outreach, or suppression rather than repeated attempts.
Voter contact rate
Voter contact rate = unique voters contacted ÷ unique voters attempted × 100
This is one of the most useful GOTV metrics, but only when “contacted” is defined consistently. Use unique voters in both parts of the formula. Attempts per contact can then show the effort required:
Attempts per contact = total attempts ÷ unique voters contacted
A falling contact rate may indicate bad timing, weak data, an exhausted universe, or a channel mismatch. It does not automatically mean volunteers are underperforming.
Meaningful conversation and voting-plan rates
Meaningful conversation rate = voters with a qualifying conversation ÷ unique voters contacted × 100
Voting-plan completion rate = voters who completed a voting plan ÷ voters with a meaningful conversation × 100
A useful voting-plan record may include method, intended day, approximate time, location, and transportation or identification needs. The purpose is not to collect detail for its own sake. It is to make the voter’s next action specific and reveal barriers the campaign can help address.
Barrier identification and resolution
Track barriers by type, such as polling-place information, transportation, accessibility, work schedule, ballot status, identification questions, or uncertainty about voting method.
Barrier resolution rate = voters with a resolved barrier ÷ voters who reported a barrier × 100
The resolution field should describe the action taken. “Sent polling-place link” is more useful than “handled.” If the campaign cannot resolve a request immediately, route it to a named queue with an owner and deadline.
Volunteer capacity and productivity
Track:
- Volunteers scheduled
- Volunteers who attended
- Active volunteer hours
- Attempts per active hour
- Contacts per active hour
- Meaningful conversations per active hour
- Data-completion rate
Volunteer attendance rate = volunteers who attended ÷ volunteers scheduled × 100
Contacts per active hour = unique voter contacts ÷ active volunteer hours
Use productivity metrics for coaching and capacity planning, not public shaming. Compare people doing similar work, on similar shifts, with comparable lists and tools. A volunteer assigned a difficult low-connect universe should not be judged against someone calling recent responders.
Cost and data quality
Cost per contact = attributable channel cost ÷ unique voters contacted through that channel
Cost per voting plan = attributable channel cost ÷ voters completing a voting plan through that channel
Document what “cost” includes. A tool-only calculation is different from one that includes staff time, paid organizers, data, training, and creative work.
Also track missing dispositions, duplicate voter records, wrong numbers, invalid addresses, opt-outs, stale ballot status, and the delay between an interaction and its appearance in the dashboard. A report cannot be more current than its slowest critical data feed.
Compare phone, text, canvassing, and relational outreach
Raw totals do not make channels comparable. One text program may reach a large universe quickly, while a canvass program reaches fewer people with longer conversations. Normalize performance by the opportunity, time, and cost involved.
| Channel | Useful operational measures | Useful outcome measures | Interpretation caution |
|---|---|---|---|
| Phone banking | Dials, connections, volunteer hours, attempts per hour | Direct contacts, conversations, voting plans, barriers resolved | Connected calls and voter contacts are not the same |
| Texting | Messages sent, delivered, replies, opt-outs, response latency | Unique responders, voting plans, information requests, resolved barriers | Delivery does not indicate that the voter read or acted on the message |
| Canvassing | Doors assigned, doors attempted, turf completion, active hours | Direct contacts, household contacts, conversations, commitments | Literature drops should remain separate from live contacts |
| Relational outreach | Volunteers activated, contacts assigned, touches logged | Replies, confirmed plans, personal follow-ups completed | Self-reported activity can be incomplete without simple logging |
For each channel, compare contact rate, voting-plan rate, barrier-resolution rate, contacts per active hour, and cost per contact. Then segment by geography, voter group, time window, and attempt number.
Overlap needs its own report. If a voter receives a text and then answers a call, do not credit both channels with creating one unique contact. Use a shared voter ID and record the sequence of touches. Multi-touch reporting should show assistance, not manufacture extra people.
The existing CallHub guide to GOTV texting offers channel-specific considerations for message timing and response handling. The measurement layer should bring those texting results into the same voter-level view as calls, canvassing, and relational outreach. For campaigns running these channels from one system, CallHub’s GOTV outreach platform is built to unify phone, text, and volunteer coordination so this voter-level view is easier to maintain.
Read mid-campaign data and shift resources
Mid-campaign reporting is useful only if it changes action. Establish a review cadence before the final push: daily early in GOTV, then by shift or at set checkpoints as election day approaches.
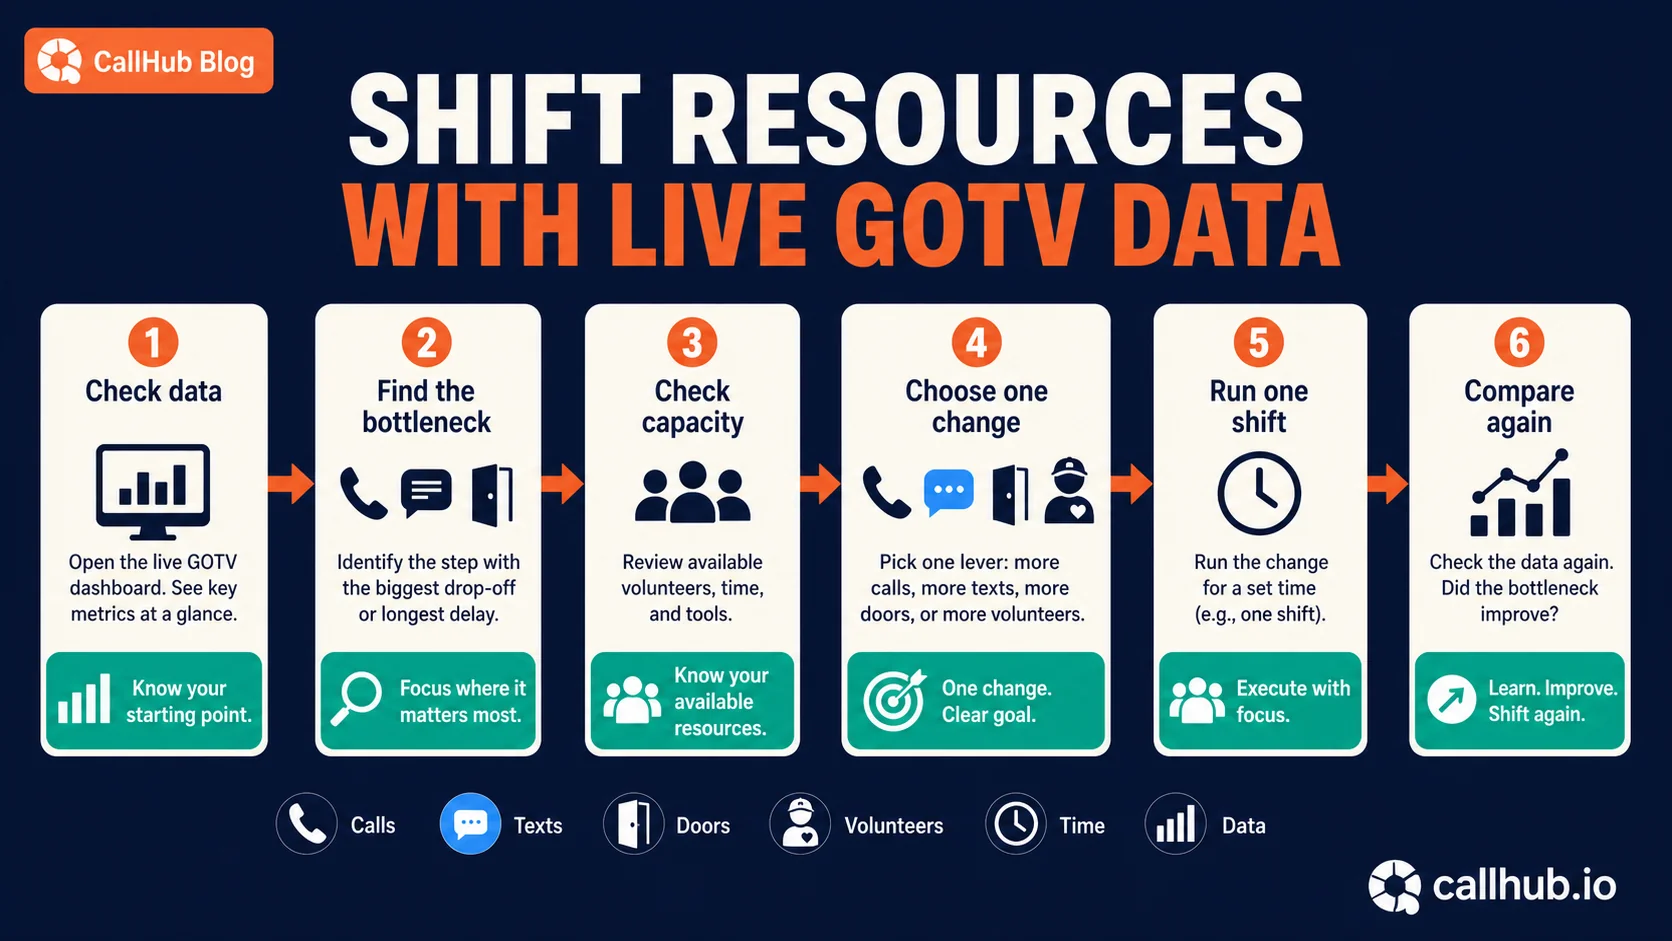
Use this sequence:
- Check freshness and completeness. Confirm that the latest calls, texts, doors, dispositions, opt-outs, and ballot-status updates are present.
- Find the bottleneck. Look for the largest unexpected drop between assigned, attempted, reached, contacted, and voting-plan stages.
- Check capacity. Review available volunteers, staff, calling windows, canvass travel time, texting throughput, and unresolved help requests.
- Choose one change. Adjust the list, timing, script, training, staffing, or channel mix.
- Run the change for a defined shift. Record the start time and the affected audience.
- Compare again. Use the same definitions and a comparable baseline before expanding the change.
| Signal | Possible cause to check | Practical action |
|---|---|---|
| High attempt volume, low delivery | Stale numbers, invalid addresses, carrier filtering | Clean data, suppress invalid records, route voters to another channel |
| High delivery, low response | Weak timing, unclear message, poor audience fit | Test a clearer prompt or move the next attempt to a better window |
| Strong contacts, few voting plans | Script ends before planning questions | Coach on method, time, location, and barrier prompts |
| Many barriers, slow resolution | No owner or service-level target | Create a queue, assign owners, and set deadlines |
| Low volunteer attendance | Long or vague shifts, weak confirmation | Shorten the ask, reconfirm, and keep standby volunteers |
| High activity, missing dispositions | Training or interface friction | Pause briefly, simplify disposition choices, and audit a sample |
Avoid changing several variables at once. If you replace the list, script, calling window, and volunteer team together, the next result will be difficult to interpret.
Build a GOTV reporting dashboard
A campaign manager should be able to understand the state of the program in a few minutes, then drill into the details. A single page of colorful totals is not enough.
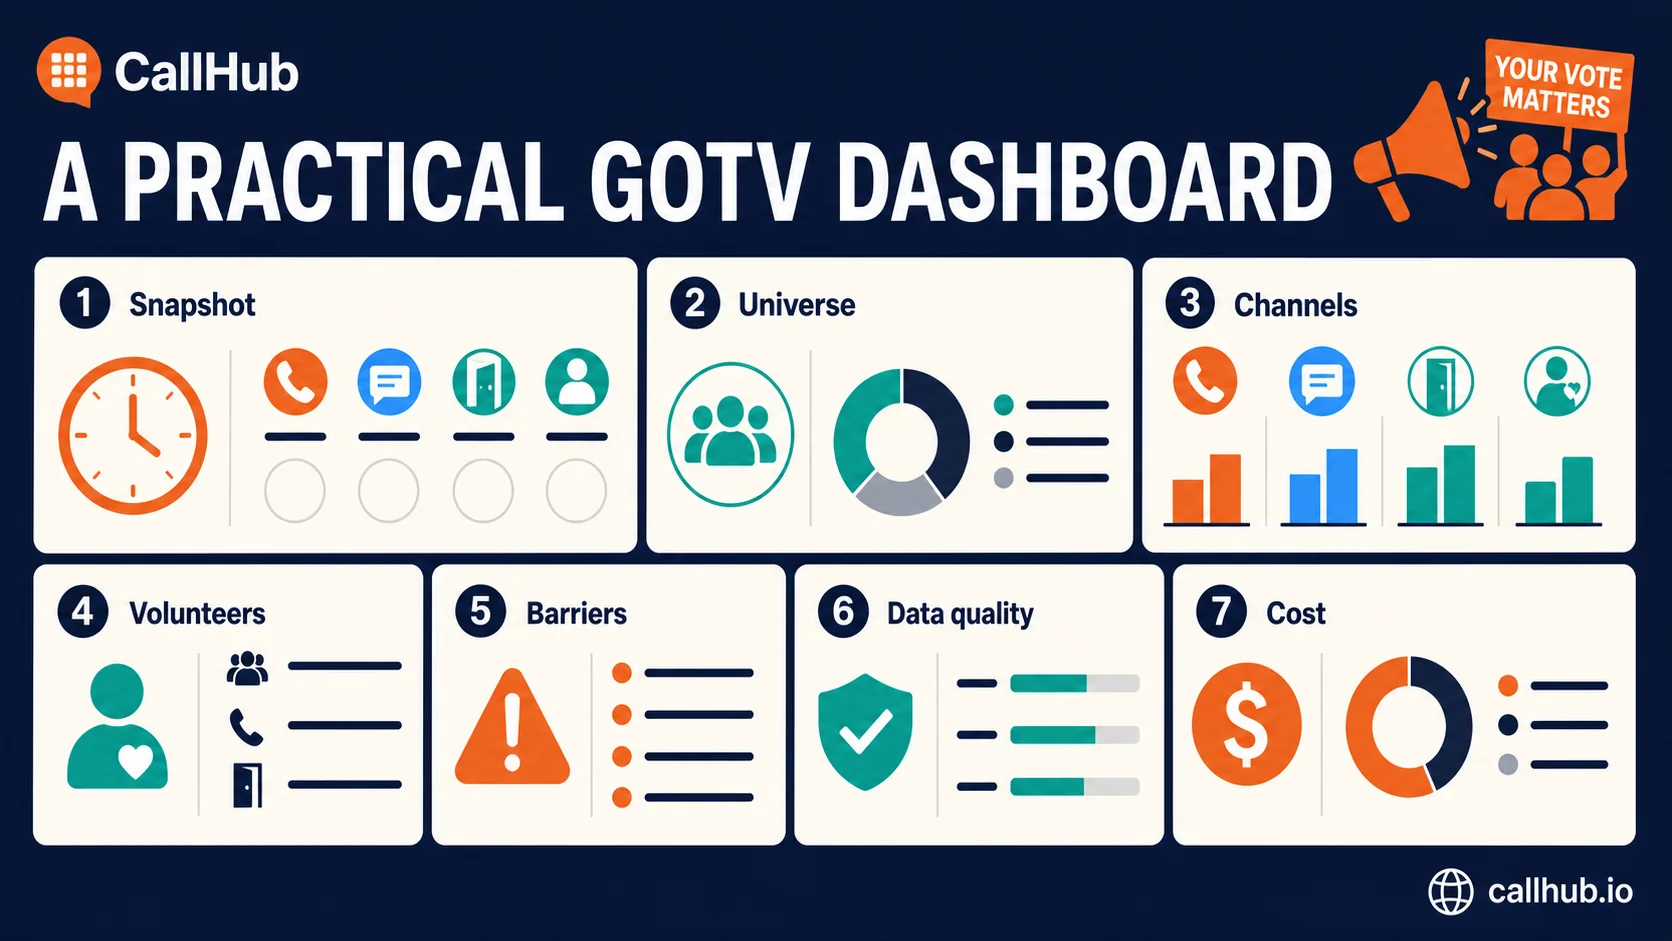
Build the dashboard in layers:
- Executive snapshot: universe remaining, unique reach, voter contact rate, voting plans, unresolved barriers, volunteer coverage, and data timestamp
- Universe view: assigned, attempted, untouched, suppressed, already voted, and remaining by segment
- Channel view: attempts, delivery, contacts, conversations, plans, costs, and opt-outs by channel
- Volunteer view: scheduled, attended, active hours, contacts per hour, completion, and coaching flags
- Barrier view: open, resolved, overdue, type, geography, owner, and time to resolution
- Data-quality view: missing dispositions, invalid records, duplicate IDs, sync failures, and reporting latency
- Cost view: spend to date, cost per contact, cost per plan, and projected capacity
Add filters for day, shift, geography, voter segment, channel, team, and attempt number. Display the last refresh time and the coverage period beside every time-sensitive report.
Keep diagnostic detail one click below the main view. A campaign manager needs the bottleneck first; an operations lead may then need the list, volunteer shift, or integration that produced it.
Measure turnout lift without overstating causality
Validated turnout is an outcome. It is not automatically evidence that the outreach caused that outcome.
Voters who answer calls or reply to texts may already be more engaged than those who do not respond. Comparing turnout among contacted and uncontacted voters therefore mixes the effect of outreach with pre-existing differences.
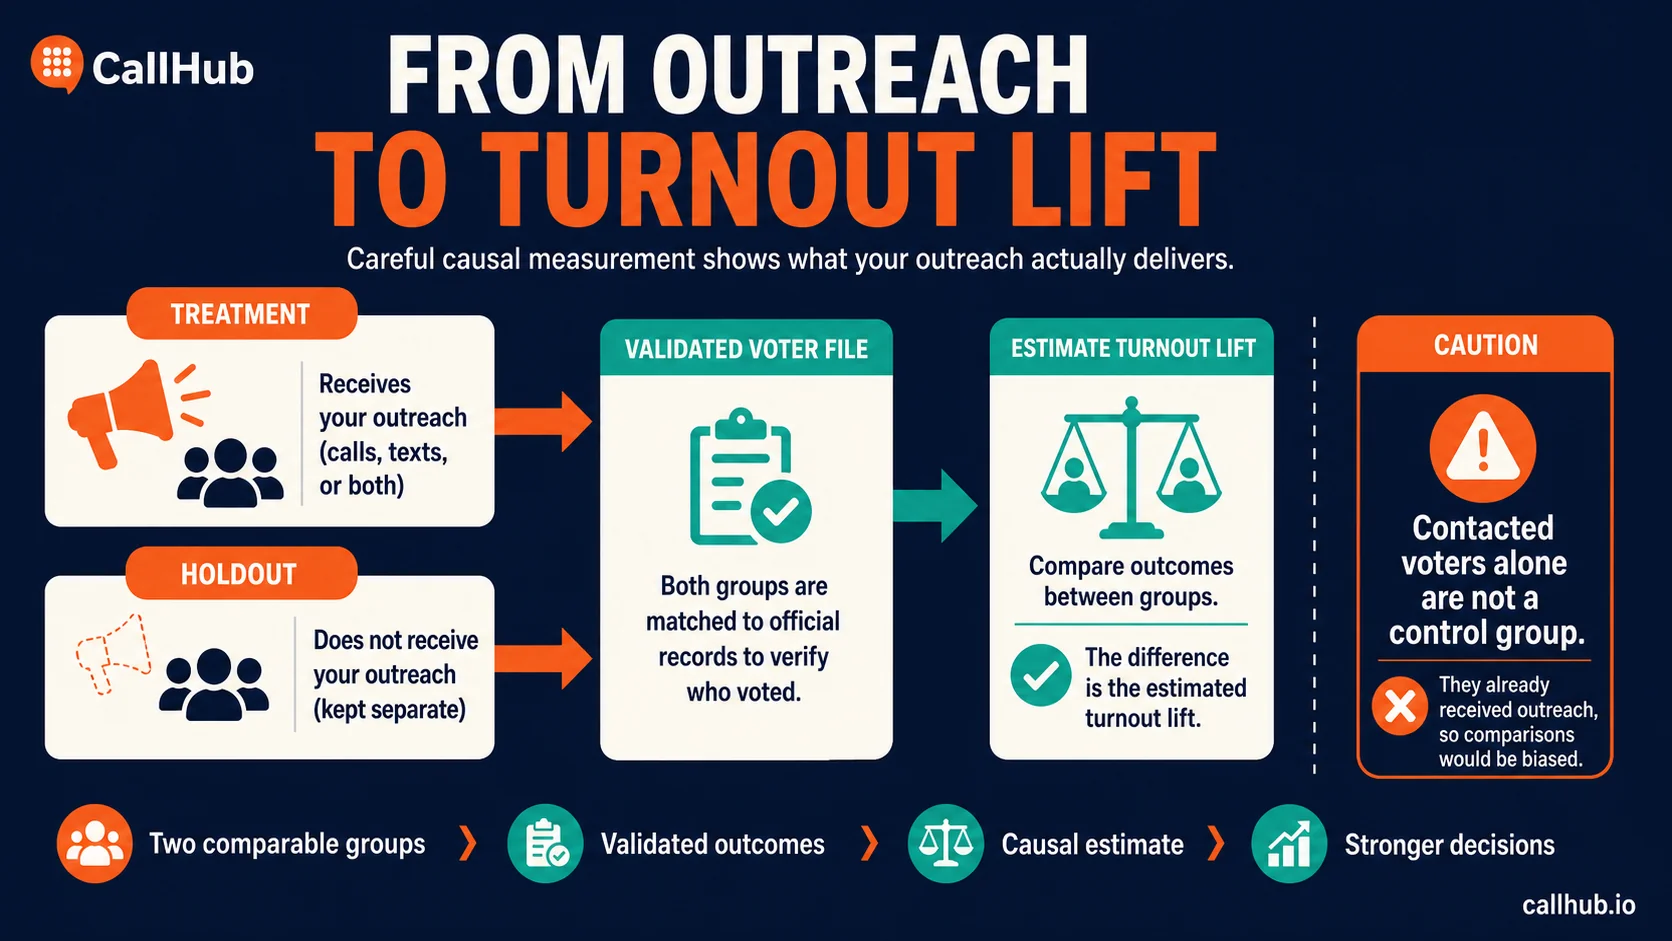
The strongest practical design is a randomized holdout:
- Define the eligible GOTV universe before outreach.
- Randomly assign voters to a treatment group and a no-contact holdout group.
- Keep the assignment intact and record crossovers or spillover.
- Run the planned program for the treatment group.
- Match both groups to the same validated voter file after the election.
- Compare turnout based on original assignment.
Turnout lift = treatment-group turnout rate − holdout-group turnout rate
This is an intent-to-treat estimate: it measures the effect of being assigned to the program, including voters the campaign attempted but never contacted. That preserves the value of random assignment.
Report the group sizes, assignment method, treatment window, outcome source, matching rules, exclusions, crossover, and statistical uncertainty. Small samples can produce large-looking differences that are too uncertain to guide future spending.
Field experiments have long used randomized treatment and control groups with official voter-file validation to separate mobilization effects from selection. Campaigns & Elections describes this approach in its discussion of measuring GOTV programs with control groups.
If a randomized holdout is not feasible, be precise about the limitation. A matched comparison or historical baseline can support a directional assessment, but it relies on stronger assumptions. Label it as observational rather than causal.
Run a post-election GOTV analysis
The post-election review should begin before memories fade, but the final outcome analysis may need to wait for a validated voter file. Separate the immediate operational debrief from the later turnout study.
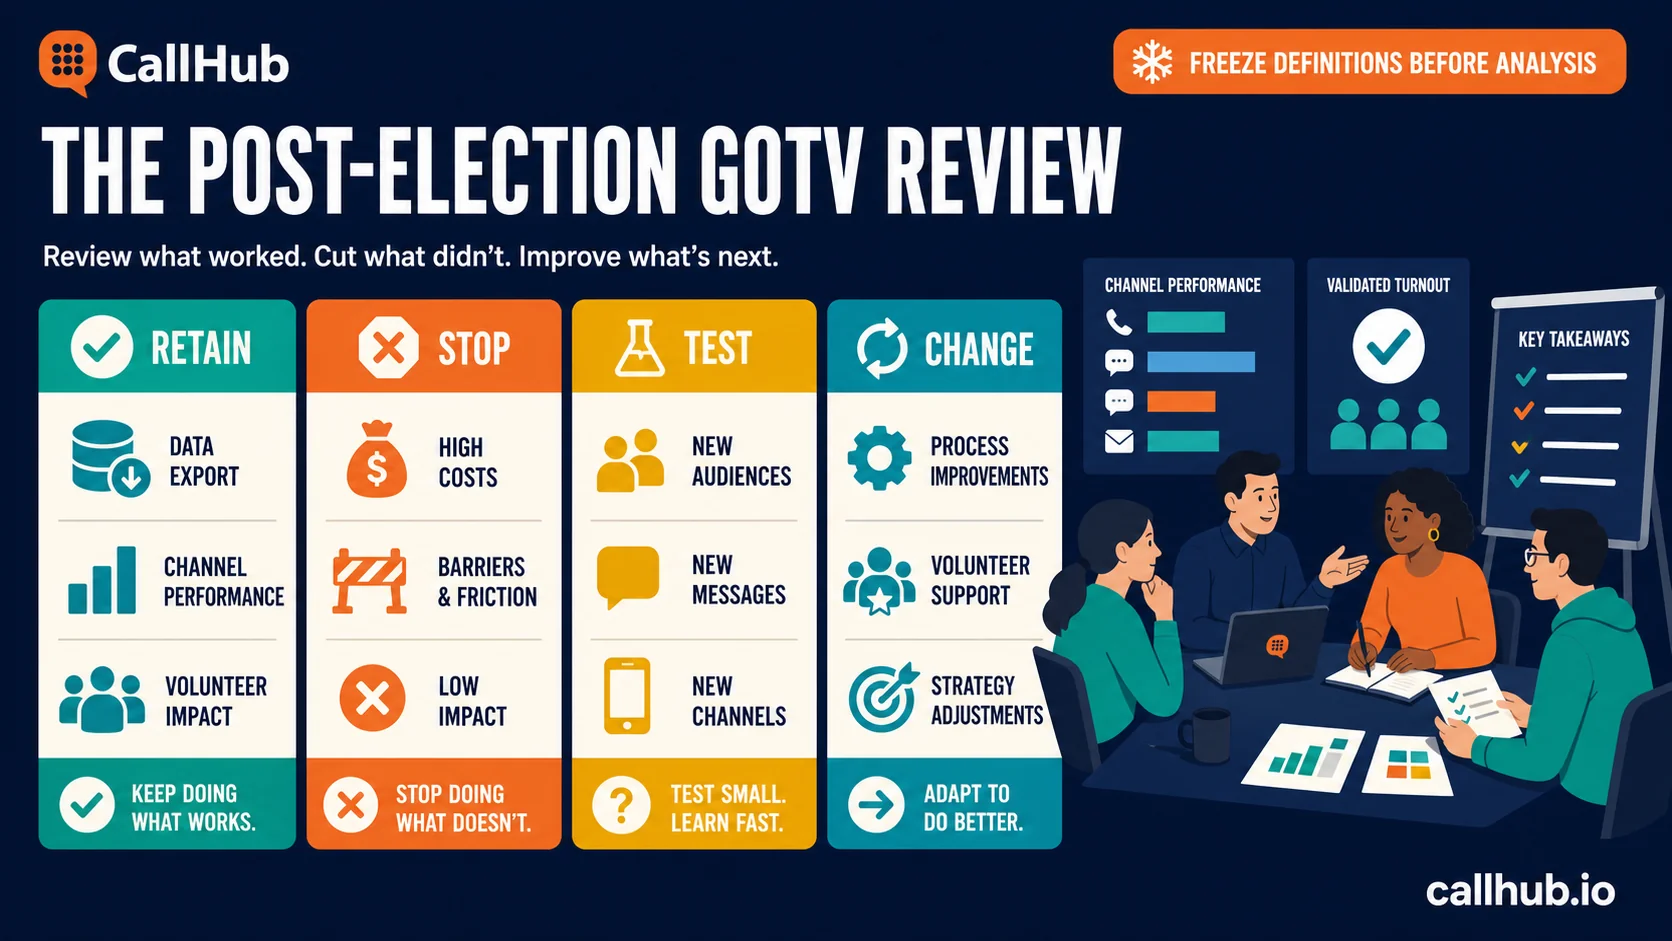
Start by freezing the data definitions, exports, scripts, list versions, experiment assignments, costs, staffing records, and dashboard snapshots. Document known sync problems and manual corrections.
Then compare planned and actual performance:
| Review area | Questions to answer | Decision to record |
|---|---|---|
| Universe | Who was selected, reached, missed, suppressed, or contacted too often? | Retain or change targeting and capacity assumptions |
| Channels | Where did delivery, contact, planning, cost, or latency differ? | Retain, stop, or test the channel use |
| Volunteers | Which recruitment, training, shift, and support practices held up? | Retain support practices or change staffing |
| Barriers | Which needs appeared, and how quickly were they resolved? | Build earlier partnerships or escalation paths |
| Data | Where were dispositions, IDs, syncs, or ballot statuses unreliable? | Fix systems and definitions before the next cycle |
| Impact | What can the validated outcome study support? | Separate causal findings from observations |
Interview field leads and volunteers while the details are fresh. Ask where scripts broke down, which dispositions were confusing, when lists arrived late, and where voters needed help that the campaign could not provide.
End with four decision columns: retain, stop, test, and change. Assign an owner and due date to every systems change. Store the debrief with the data dictionary, final report, scripts, training materials, and experiment notes so the next cycle begins with evidence instead of memory.
GOTV metrics FAQs
What are the most important GOTV metrics?
Start with universe size, unique reach, voter contact rate, meaningful conversation rate, voting-plan completion, barriers resolved, volunteer attendance and contacts per active hour, cost per contact, data quality, and validated turnout. The exact dashboard can vary, but every rate needs a consistent definition and denominator.
How do you calculate voter contact rate?
Divide the number of unique voters contacted by the number of unique voters attempted, then multiply by 100. Define a valid contact for each channel before outreach starts. Do not use total attempts as the numerator because repeated attempts can inflate the result.
What is a good GOTV contact rate?
There is no universal benchmark. Contact rates vary by list quality, audience, geography, channel, calling window, attempt number, and definition. Compare a campaign against its own recent, like-for-like shifts and investigate meaningful changes rather than chasing an unsupported generic target.
How should campaigns compare phone, text, and canvassing?
Compare normalized measures such as unique contact rate, voting-plan rate, barriers resolved, contacts per active hour, cost per contact, and reporting latency. Keep channel-specific definitions visible, and deduplicate voters across channels before reporting total reach.
How often should a campaign review GOTV data?
Review it daily at the start of the GOTV period and by shift or scheduled checkpoints during the final days. The cadence must match the campaign’s ability to act. Always check the dashboard timestamp and data completeness before moving resources.
What is the difference between contact rate and turnout lift?
Contact rate measures how many attempted voters the campaign reached. Turnout lift estimates how much the program changed validated turnout compared with a suitable counterfactual, ideally a randomized holdout. A strong contact rate is an operational result, not proof of causal impact.
How do you measure GOTV volunteer productivity?
Use active hours, attempts per active hour, unique contacts per active hour, meaningful conversations, voting plans, and data-completion rate. Compare volunteers working similar lists, channels, and shifts. Use the data to improve training and capacity, not to penalize people for difficult assignments.
What should a post-election GOTV report include?
Include the final universe, definitions, planned-versus-actual activity, channel and volunteer performance, costs, data-quality issues, unresolved barriers, overlap across channels, validated turnout methodology, limitations, and decisions to retain, stop, test, or change. Save the supporting exports and data dictionary with the report.