

Table of Contents
One of the most valuable tools at a campaign manager’s disposal is the wealth of data generated through the call center report. These reports provide deep insights into key performance indicators (KPIs) such as call volumes, average handle times, agent productivity, and more.
But raw data is only useful if you know which numbers to look at and what they mean.
Success in today’s call center is measured against clear industry benchmarks: leading organizations aim to answer at least 80% of phone calls within 20 seconds, achieve first-contact resolution rates above 75%, and keep average handle times just over 6 minutes.
When properly utilized, a call center report offers actionable insights that can significantly improve the success of any calling campaign.
This article explores the importance of call center reports, where you can find these reports in your CallHub account, and how they can be strategically used to enhance call center results.
What is a call center report?
Your call center reports are the collected performances of all the campaigns you have undertaken using the CallHub tool. The call center report helps you identify KPIs for any particular time or calling campaign and understand overall trends.
The call center report in CallHub lets you see:
- Individual campaign performance
- Performance of all call center agents
- How the team performed overall
You can access these reports by logging into your CallHub account > Reports.
Read More: The complete call center software buyer’s guide
CallHub’s call center report dashboard
Reports are the goldmine of information that will allow you to fine-tune your efforts and let you know exactly where you stand regarding cost, performance, and your agents’ work. Here’s a look at the call center report CallHub offers.
Call center report
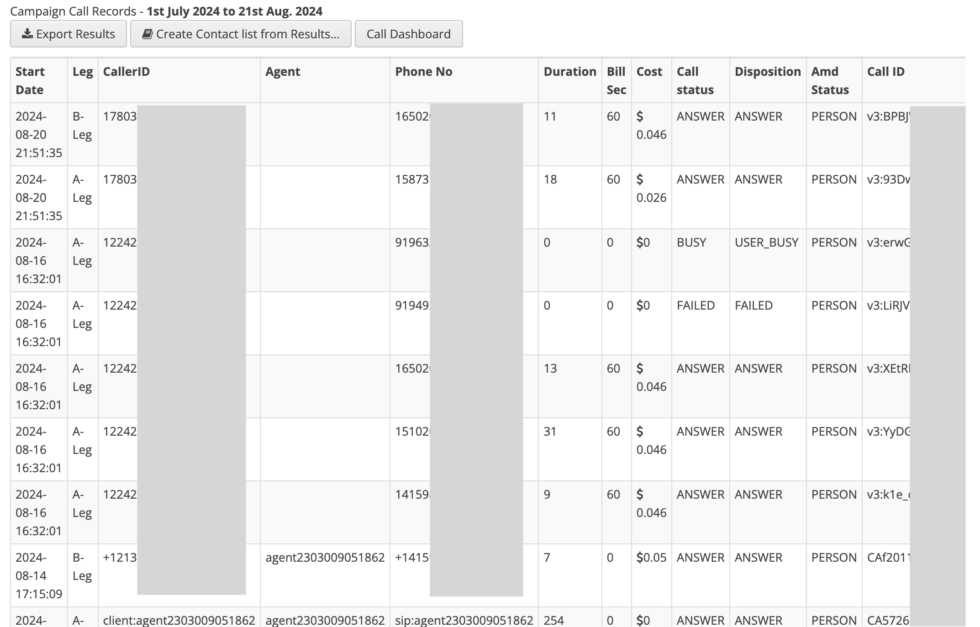
Image: Call center report samples – Campaign calls section
Once you log in to your account, you can access it through the main navigation on the left. This provides a comprehensive call center report, including all campaigns, expenditures, and management handled by your account through CallHub. These reports not only offer visibility into agent and campaign performance but also provide valuable insights to improve customer retention.
These reports are especially useful for call center managers to monitor operations, evaluate agent performance, and make data-driven decisions.
This section lets you see reports based on Calls, Texts, and call center Agents. In this article, we will focus on the ‘Calls’ section.
Calls:
This subsection provides a complete record of all calls your account makes. They are sorted under three tabs – Campaign calls, Daily report, and Other calls.
Read More: 3 Important Call Center Campaigns To Achieve Your Goals Today
Let’s look at the three tabs in detail.
Campaign calls: This tab provides an overview of the costs and durations of all calls made by your campaign, filtered by your settings. Understanding these metrics can also help you track and improve your customer satisfaction score, especially when combined with agent dispositions and call outcomes. The available columns are:
- Start Date: The date of the call.
- Leg: The connection type. Different connection types are billed at different rates.
- A-Leg indicates when an agent dials into a campaign.
- B-Leg indicates when a call is made to any contacts.
- S-Leg indicates when the call is forwarded as a patch-through call.
- CallerID: The phone number the call is associated with.
- Agent: The name/ID of the agent making the call.
- Phone No: The contact number that was dialed.
- Duration: Length of the call in seconds.
- Bill Sec: Number of seconds the call is billed for. (Calls are billed in 60-second increments.)
- Cost: The exact amount your account was billed for this call (in cents).
- Call status: Indicates whether a call was ‘connected’ or ‘abandoned’.
- Disposition: Displays the disposition inputted by the agent after the call.
- AMD Status: Did this call go to an answering machine or not?
- Call ID: The unique ID assigned to this individual call.
- Dialer Mode: The status of the dialer used in the call.
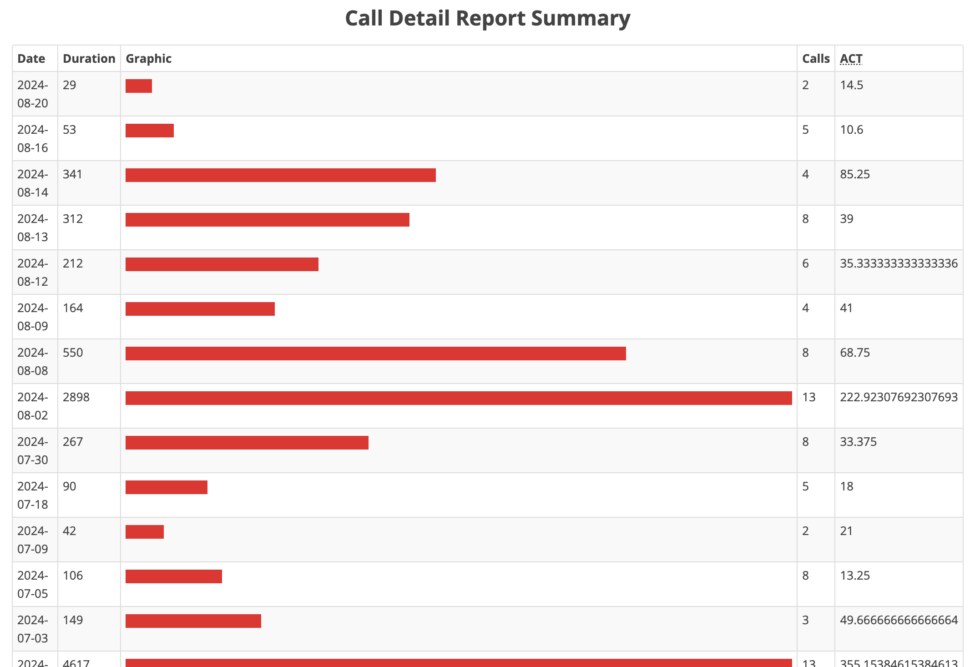
Image: Call center report samples – daily report section
Daily Report: This report primarily shows you the performance of calls on a particular day. This helps you identify patterns in your calls. Patterns like: Which is your best-performing day? Your worst? On which days do people speak the longest?
Read more: Here is a quick political phone banking guide for campaigns.
This lets you fine-tune your resource allocation and call timings to maximize returns.
[Screenshot: call-center-call-dashboard]
[Screenshot: call-center-reports-call-dashboard-1]
Call dashboard: Additionally, you can press the ‘Call dashboard’ button to launch further, in-depth statistics about your calls.
By filtering by call center campaign and the date range (past 24 hours to 30 days), you can view some trends at a glance. The visual graphs available to you are:
- Call duration: The average call duration on each day.
- Call counts: The total number of calls made on each day.
Further, you can view:
- Total calls
- Calls answered
- Calls registered as ‘busy’
- Calls that were never answered
- Calls that the agent canceled
- Calls that failed due to network congestion
- Calls that were unable to connect due to wrong numbers or technical issues
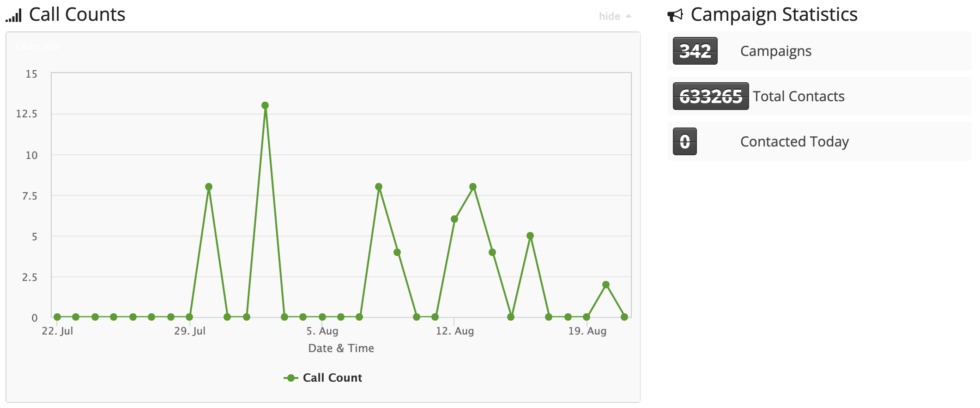
Further, you can also see how many campaigns you have conducted with CallHub, the total number of contacts across all campaigns, and how many you called today.
Read more: The Power of Skill-Based Routing in Modern Call Centers.
Actions you can take with CallHub’s call center report
Filters
These filters allow you to track your campaign performance across specific criteria, like dates, disposition, and call direction.
For example, you can find out how much your calls cost in a month, how good your calling list is based on how many calls went unanswered, or which day of the week your contacts speak to your agent the longest.
The filters you have access to are:
- Date range
- Call disposition
- Voice campaign
- Call center campaign
- Call direction (incoming calls, outgoing, all)
Export
After filtering the results, you will have the option to export them in CSV format.
The exported report contains the columns and details such as the contact’s email and address, call recording link, custom fields, answers to questions asked, supporter level, and notes.
Create a contact list
You can also ‘create contact’ from your filtered results. This lets you create custom calling lists based on factors like call disposition, unanswered calls, answering machines, or even callbacks to everyone who called on particular days.
For example, you can create a ‘call back’ list for all contacts who did not answer during this campaign or make a contact list for a second confirmation call for everyone who RSVP’d during the first call.
Read more: Caller ID reputation 101: Why it’s declining and how to fix it.
Using workflows to automate the flow of contacts
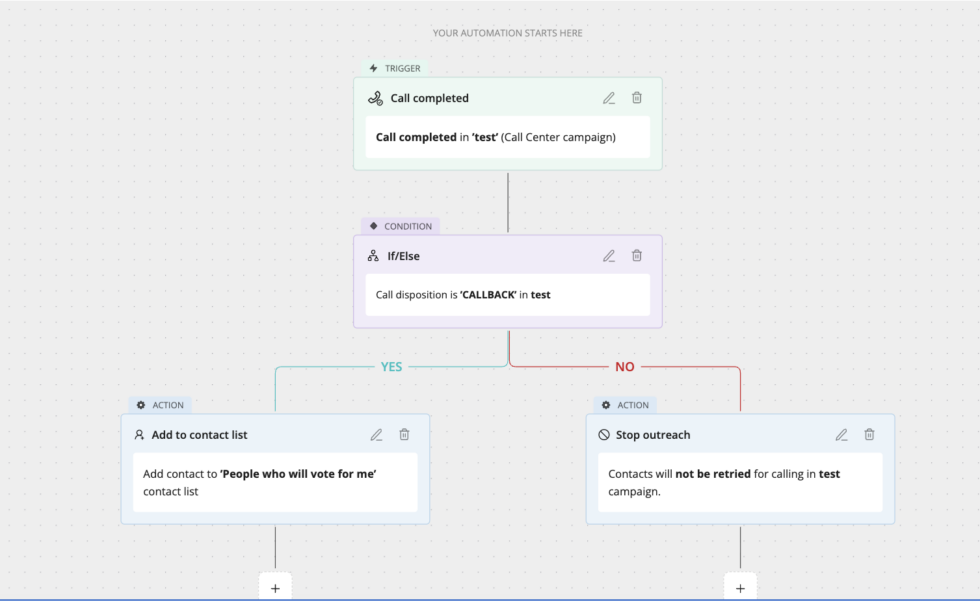
You can also use CallHub’s Workflow to automate sorting your contacts and the next step for the contact.
For example, as the image above shows, Workflows can be used to check the call disposition once the call ends in a campaign and either add the contact to a different contact list or remove them from future calls.
This is one example. You can use Workflow to:
- Add tags to contacts.
- Stop all outreach to contacts.
- Add them to customized contact lists.
- Create contact lists based on text replies from the number.
- Send them a URL for further follow-up.
CallHub’s call center analytics
If reports give you a considerable amount of data, we don’t want you to miss the trees for the forest at CallHub. We also provide analytics in your account, allowing you to identify significant trends and assess the performance of your campaigns.
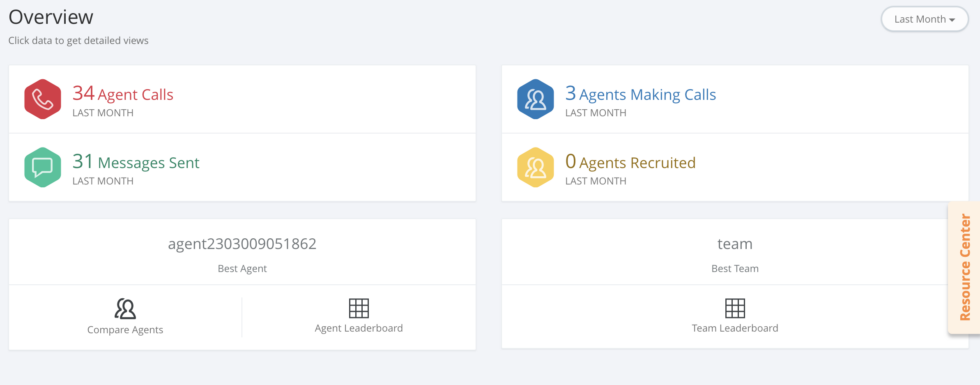
You can access this by logging into your account and choosing the ‘analytics’ tab in the top bar navigation.
Up front, you can see an overview of your agents and their productivity measured as the calls and messages are sent out, how many are making calls right now, and which call center agents are meeting the calling criteria you have laid out. You can even compare two agents to see how they match against each other.
You can navigate through the menu items on the left to get more detailed information about each type of campaign and in-depth performance reviews of your agents.
Read More: The Best Call Center Management Practices And Strategies
Call center analysis: key metrics you will find here
Here’s a look at some critical contact center reports you can access and where you can find them.
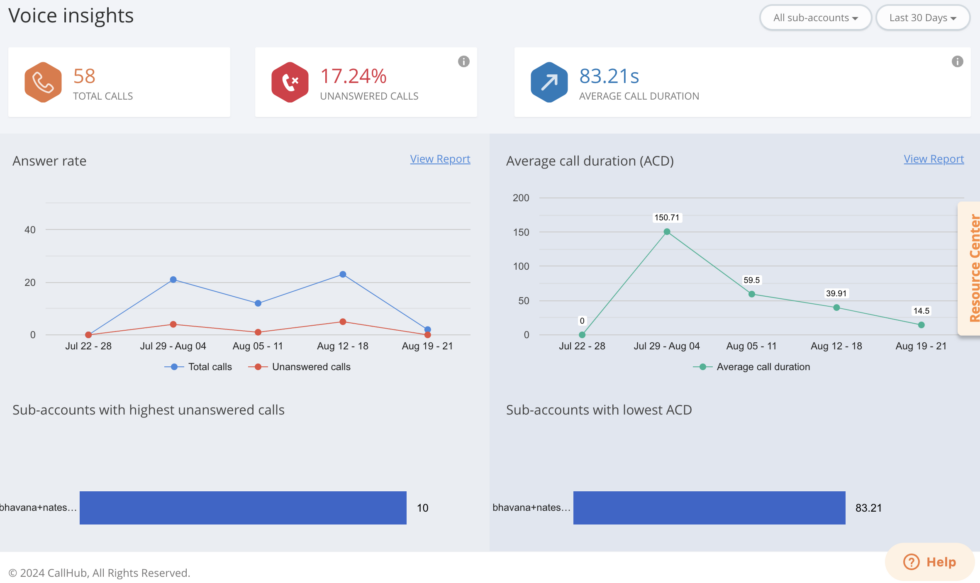
You can access these reports by choosing the ‘Voice’ option under the overview.
- Percentage of unanswered calls: A call is noted as ‘unanswered’ if the number was busy or didn’t connect. Based on CallHub campaign data, unanswered call rates above 40% typically indicate list quality issues — too many numbers that are wrong, disconnected, or unresponsive.
Note: Consistently track the quality of your list. Eliminate ‘Bad’ numbers, unavailable contacts, and unresponsive numbers from the list. CallHub’s DNC feature ensures you don’t dial numbers that have requested not to be contacted.
- Average call duration: The average call duration is calculated as the ratio of total minutes across all calls divided by the total number of calls in that period. The average call duration should be more than 20 seconds. Otherwise, you risk being marked as ‘spam’ and being blocked by telecom carriers. This threshold is driven by telecom carrier spam detection algorithms, which flag patterns of very short calls as potential auto-dialer abuse.
- The best way to avoid getting labeled as “spam” is by getting yourself a Spam Label Shield.
You can access these reports by choosing the ‘Call center reach’ tab in the left-hand menu.
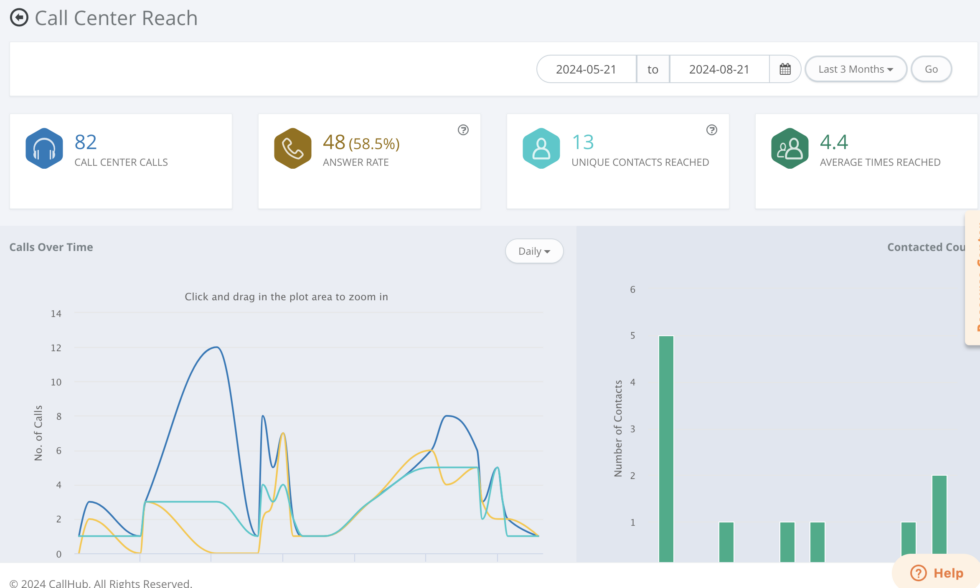
- Call center calls: The total number of calls made by all your agents through your account across all campaigns. These are especially important for high-volume calling campaigns like canvassing, GOTV, or cold calling.
- Answer rate: The percentage of calls answered by your contacts, either by a person or by an answering machine. You can consider your list ‘good’ if you have a high answer rate. If the answer rate is dropping, consider changing the timing of your calls or updating your list.
- Unique contacts reached: This displays the number of unique numbers your current campaign has called, excluding numbers you are calling back or retrying. This gives you an accurate picture of how many people your campaign reaches, since total calls include many kinds of calls (including patch-through calls).
- Average time reached: This is the average number of times every contact was reached out to from all your campaigns. The number increases if you enable callback or retries in your campaign. Maintaining consistency is essential, as too many calls from your campaign can annoy your contacts.
Agent reporting on CallHub
Like the call reports, you can access this section under the ‘Reports’ section on the main navigation once you log into your CallHub account.
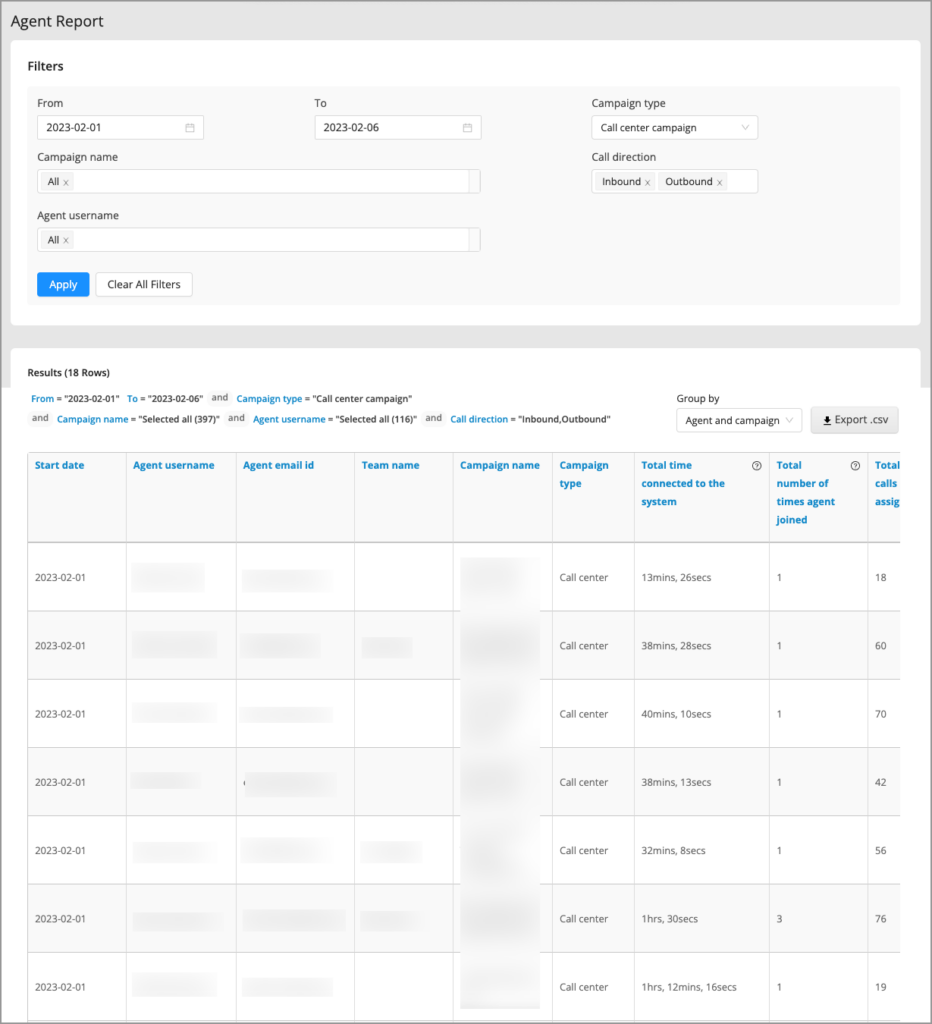
Like the calls section, these reports begin by selecting your filters. In this case, you can choose a date range, the number of agents (all or a specific group or any single one), and the campaign.
A unique filter available for agent reporting is the ‘group by’ function, which allows you to see agent performance individually for a campaign they worked on, or just sorted by the campaign.
This allows you to see agent performance on a campaign-to-campaign basis while comparing agents overall.
Read More: The Best Time To Cold Call In 2024
Agent reporting call center metrics you will find here:
- Start date: The day they were registered to your account.
- Agent username
- Agent email ID
- Team name: The team the agent was assigned to. Teams allow agents to be grouped easily and help with onboarding groups of them for specific campaigns.
- Campaign name: When you group agents by campaign, the name of the campaign they worked on within a specific date range is displayed.
- Campaign type: Whether a voice broadcast, a call center, or a texting campaign.
- Total time connected to the system: An agent’s total hours dialed in for all campaigns.
- Total number of times the agent joined: The number of times the agent has signed or dialed into various campaigns.
- Total calls assigned: Total calls assigned to the agent by the team leader, sub-account, or call center manager.
- Total calls answered: This metric excludes unanswered or poor-quality calls, focusing on calls the agent successfully connected to.
- Call direction: Inbound or outgoing calls.
- Total talk time: All the time the agent spends speaking to contacts.
- Average call duration per answered call
Read more: Call monitoring: Why does your call center need it?
Innovative insights for the call center report
Continuing to go beyond just reports, CallHub also offers you new ways to analyze the hundreds of thousands of calls you make to generate patterns that help with course correction.
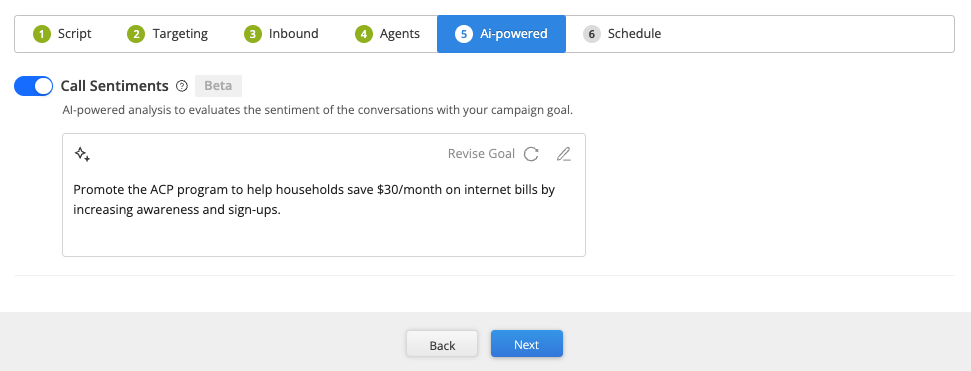
CallHub’s AI-powered Smart Insights for Contact Center campaigns use AI to analyze call transcripts generated after each call. The system assesses call recordings and evaluates campaign effectiveness through ‘sentiment analysis.’
This means the system tracks predefined goals (decided when the campaign is created, based on your script, or you can manually add the goal) and measures the sentiment of each contact against that goal.
The system also generates insights for you to review by summarizing call transcripts, saving your team from having to read, rate, and rewrite thousands of transcripts manually.
You can activate ‘Smart Insights’ when you create a campaign. It has a dedicated tab.
Read more: Remarkably effective call center quality assurance guide.
The above call center report samples aim to show you how to track your campaigns best. As a campaign manager, you must be in sync with your campaigns, understand their shortcomings, and develop solutions to improve them.
Types of call center reports
Not all call center reports serve the same purpose. Understanding which report to pull — and when — is what separates a campaign manager who reacts to problems from one who prevents them. Here are the main types you will find across a modern call center reporting system:
| Report type | What it shows and when to use it |
| Daily performance report | Call volume, answer rate, and average handle time for each day. Review every morning to catch problems before they compound — a sudden drop in answer rate or a spike in unanswered calls often signals a list or timing issue. |
| Agent performance report | Calls handled, talk time, call outcomes, and average call duration per agent. Use weekly to identify who needs coaching and who is performing above benchmark. |
| Campaign report | Outcomes across all calls in a specific campaign — cost, contacts reached, dispositions, and answer rate. Essential for comparing campaign effectiveness and calculating cost per meaningful conversation. |
| Real-time dashboard | Live view of agents currently on calls, call queue status, and active campaign metrics. Use during a calling shift to monitor volume and spot agents who are idle or disconnected. |
| Historical trend report | Week-over-week or month-over-month comparisons of call volume, answer rate, and campaign ROI. Use monthly for strategic decisions: list refresh, dialer recalibration, and resource planning. |
| AI sentiment / Smart Insights report | AI-analyzed call transcripts scored against predefined campaign goals. Surfaces patterns across thousands of calls that manual review would miss — tone shifts, common objections, and goal completion rates. |
CallHub gives you access to all six of these report types from your analytics dashboard. The campaign report and daily report are accessible directly under Reports > Calls. Agent reports live under Reports > Agents. Smart Insights is activated per campaign.
Call center reporting benchmarks: what good looks like
Numbers in a report only mean something when you can compare them against a standard. These are the benchmarks that define what a healthy call center looks like — and what the data is telling you when the numbers fall short.
| Metric | World-class benchmark | Warning threshold | Source |
| First Contact Resolution (FCR) | 85%+ | Below 70% | SQM Group annual research |
| Answer rate (outbound) | Above 60% | Below 40% | CallHub campaign data |
| Unanswered call rate | Below 40% | Above 40% = list quality issue | CallHub campaign data |
| Average Handle Time (AHT) | ~6 minutes | Varies by campaign type | ICMI / Sprinklr benchmarks |
| Call abandonment rate (inbound) | Below 5% | Above 8% | ICMI industry standard |
| Average call duration | Above 20 seconds | Below 20 seconds = spam risk | Telecom carrier guidelines |
| Service level (inbound) | 80% answered in 20 seconds | Below 70% in 20 seconds | Sprinklr / ICMI standard |
| These are directional benchmarks. Political phone banking campaigns typically see different answer rates than nonprofit fundraising calls or union member outreach. Always compare your data against campaigns of the same type and similar contact list sources. A 35% answer rate on a cold voter file is healthy; the same rate on a warm donor list signals a problem. |
Track these metrics directly in CallHub’s call center analytics dashboard. For a full breakdown of each metric and how to improve it, see our guide to call center metrics and KPIs.
Reporting cadence: what to review and when
A report reviewed at the wrong moment is as useless as no report at all. Here is how to build a cadence that keeps your campaign on track without creating reporting overhead.
Daily — spot problems before they compound
Check answer rate, unanswered call volume, and agent login count at the start of each calling shift. A sudden drop in answer rate is almost always either a list issue (too many stale numbers) or a timing issue (calling outside peak windows). Catching it on day one saves an entire week of wasted calls.
Responsible: campaign manager or team lead.
Weekly — course-correct mid-campaign
Review agent performance comparisons, campaign call volume trends, DNC opt-out rates, and average call duration. This is the cadence for tactical decisions: adjusting dialer settings, refreshing contact lists, rebalancing agent assignments, and identifying volunteers who need additional script coaching.
Responsible: campaign manager.
Monthly — strategic decisions
Pull cost per contact, first contact resolution rate, overall campaign ROI, and list health across all campaigns run in the period. This is the cadence for organizational decisions: budget allocation, list procurement strategy, dialer type selection for the next campaign cycle, and presenting results to leadership.
Responsible: campaign manager + leadership.
CallHub’s export function (Reports > Calls > Export to CSV) makes it straightforward to pull the data for each of these reviews. For agent-level weekly reviews, filter by agent and campaign under Reports > Agents. For monthly summaries, use the analytics dashboard and filter by date range.
Call center report template: a sample structure
Below is a sample weekly call center report structure. You can export this data directly from CallHub under Reports > Calls > Campaign Calls, filtered by the date range you need, and export to CSV.
Sample weekly campaign performance report
| Campaign | Date range | Total calls | Answer rate | Avg duration | Unanswered % | Agent count | Top disposition |
| GOTV — Ward 4 | Jun 9–15 | 2,847 | 61% | 1m 42s | 39% | 12 | Will vote |
| [Campaign name] | [Date range] | [Total] | [%] | [m:ss] | [%] | [n] | [Disposition] |
| [Campaign name] | [Date range] | [Total] | [%] | [m:ss] | [%] | [n] | [Disposition] |
| [Campaign name] | [Date range] | [Total] | [%] | [m:ss] | [%] | [n] | [Disposition] |
Sample agent performance report (weekly)
| Agent | Campaign | Calls assigned | Calls answered | Avg duration | Total talk time | Top outcome |
| [Agent name] | [Campaign] | [n] | [n] | [m:ss] | [h:mm] | [Disposition] |
| [Agent name] | [Campaign] | [n] | [n] | [m:ss] | [h:mm] | [Disposition] |
| [Agent name] | [Campaign] | [n] | [n] | [m:ss] | [h:mm] | [Disposition] |
Copy this structure into your reporting workflow. CallHub’s CSV export gives you all of these columns directly. For the agent report, go to Reports > Agents, apply your date range filter, and group by campaign.
Stay data-driven with CallHub
CallHub campaigns are always data-driven and course-corrected to ensure you get the best results for every call. The reports, analytics, and AI-powered Smart Insights covered in this article give you everything you need to monitor performance, catch problems early, and make decisions based on what your data is actually showing.
For a deeper look at how to interpret the numbers and improve campaign outcomes, see our guide to call center analytics. If you are running a phone banking campaign specifically, see how CallHub’s phone banking software handles calling lists, scripts, and real-time reporting in one place. To start your next campaign with better reporting built in, explore CallHub’s call center software.
FAQs on call center report
Why is contact center reporting important?
Contact center reporting provides visibility into operations, agent productivity, and customer experience. It enables organizations to identify strengths and weaknesses, optimize resource allocation, and ensure compliance with service level agreements (SLAs). Effective reporting supports continuous improvement and better customer outcomes.
What are the most important metrics in a call center report?
Key metrics include First Contact Resolution (FCR), Net Promoter Score (NPS), Customer Satisfaction Score (CSAT), Average Handle Time (AHT), Call Abandonment Rate, Service Level, and Agent Occupancy. See our call center metrics and KPIs guide for a full breakdown of each. The right metrics depend on your organization’s goals and customer expectations.
How does AI improve call center reporting?
AI enhances call center reporting by automating data analysis, providing real-time insights, and identifying patterns in large datasets. Features like sentiment analysis, predictive scoring, and automated quality monitoring help managers understand customer needs, forecast trends, and improve agent performance. CallHub’s AI Smart Insights applies this directly to your call transcripts.
What is sentiment analysis in contact center reporting?
Sentiment analysis uses AI to evaluate the tone and emotion in customer interactions, such as call transcripts or chat logs. It helps organizations gauge customer satisfaction, detect issues early, and tailor responses to improve the overall experience.
How can I use texting campaigns to improve agent performance?
Call center reports highlight individual and team performance metrics, such as call handling time, resolution rates, and customer feedback. Managers can use these insights to identify training needs, recognize top performers, and implement targeted coaching for continuous improvement.
What are the different types of call center reports?
The main types are daily performance reports (call volume and answer rate by day), agent performance reports (calls handled and talk time per agent), campaign reports (outcomes across a full campaign), real-time dashboards (live call and agent status), historical trend reports (week-over-week comparisons), and AI sentiment reports (call transcript analysis against campaign goals). Each serves a different decision horizon — daily for operational adjustments, weekly for tactical changes, monthly for strategic planning.
What is a good call center reporting cadence?
Review answer rate and agent productivity daily during active campaigns. Run a full agent performance comparison weekly, along with campaign trend data and DNC opt-out rates. Pull cost per contact, FCR, and overall ROI monthly for strategic review. Ownership: campaign manager for daily and weekly reviews, leadership for monthly.
What is the difference between call center reporting and call center analytics?
Reporting shows what happened — historical data in table or list format covering calls made, outcomes recorded, and costs incurred. Analytics shows why it happened and what to do next — trends, patterns, and predictive insights derived from the same data. Both are available in CallHub: reports under the Reports menu, analytics under the Analytics tab. See our full call center analytics guide for how to use each.
What is FCR and why does it matter in call center reporting?
FCR stands for First Contact Resolution — the percentage of contacts who get their issue resolved, or their survey or RSVP completed, in a single call without a callback. World-class FCR is 85% or above (SQM Group). In phone banking and advocacy calling, FCR means completing the interaction during the first call: no callback needed, no follow-up required. A low FCR increases your cost per meaningful conversation and strains volunteer time. Track it in your campaign disposition data under Reports > Calls > Campaign Calls.