



Most campaigns track two numbers: Total registered voters and confirmed supporters. Neither one determines whether you win. Voter turnout does.
The voter turnout definition, in its most useful form for field planning, is the percentage of eligible voters who cast a ballot in a given election. In 2020, that figure reached 66.8% in the United States, the highest since 1900. In local elections, the same eligible voter population shows up at 15–27%. That gap is the entire reason your mobilization program exists.
Which eligible voters belong in the formula? What baseline should you plan against in your specific race type? This article covers the definition, the right formula to use, what turnout looks like across presidential, midterm, and local races, and what it means for your field plan. For how this fits into the full mobilization program, see the complete GOTV playbook.
What is voter turnout?

Voter turnout is the percentage of eligible voters who cast a ballot in an election. It is calculated by dividing total votes cast by the total number of eligible voters in that jurisdiction. Field directors use it to set mobilization targets, benchmark against comparable races, and evaluate whether a get-out-the-vote (GOTV) program increased participation.
The operational definition for campaign use: Voter turnout is the ratio that translates your supporter universe into expected ballots cast. If turnout is 20% in your local race and you have 3,000 supporters in a 12,000-voter jurisdiction, your expected ballots from that universe is 600, not 3,000. Field plans that ignore this ratio consistently overestimate election-day performance.
Voter turnout vs. voter participation
Voter turnout and voter participation are often used interchangeably, but they measure different things. Voter turnout refers specifically to the act of casting a ballot, measured as a percentage of eligible voters. Voter participation is a broader concept that includes voter registration, campaign volunteering, civic engagement, and other forms of democratic involvement.
For field directors, voter turnout is the operative number. Voter participation tells you about civic health in a community. Voter turnout tells you whether your program converted registrants into ballots on election day.
Voter turnout in AP Gov
In AP Government and Politics, voter turnout is defined as the proportion of the voting-age population (VAP) that casts a ballot in a given election. The course focuses on structural determinants including registration requirements, voter identification laws, and demographic patterns. Most political scientists and practitioners prefer the voting-eligible population (VEP) as the denominator, because VAP overstates the eligible pool and produces artificially low turnout rates. That distinction matters more for field planning than for exam prep, and is covered in the next section.
How is voter turnout calculated?
The formula is:
Voter turnout = (Total votes cast ÷ Total eligible voters) × 100
Counting total votes cast is straightforward: Election authorities publish this after every race. The variable that changes the result is the denominator: Who qualifies as an “eligible voter”?
Two formulas are in common use, and they produce meaningfully different numbers.
VAP vs. VEP: Which formula matters
Voting-Age Population (VAP) counts everyone 18 or older, regardless of citizenship or legal eligibility to vote. Because non-citizens and individuals with certain criminal convictions cannot vote in most states, VAP overstates the eligible population and artificially depresses the reported turnout rate.
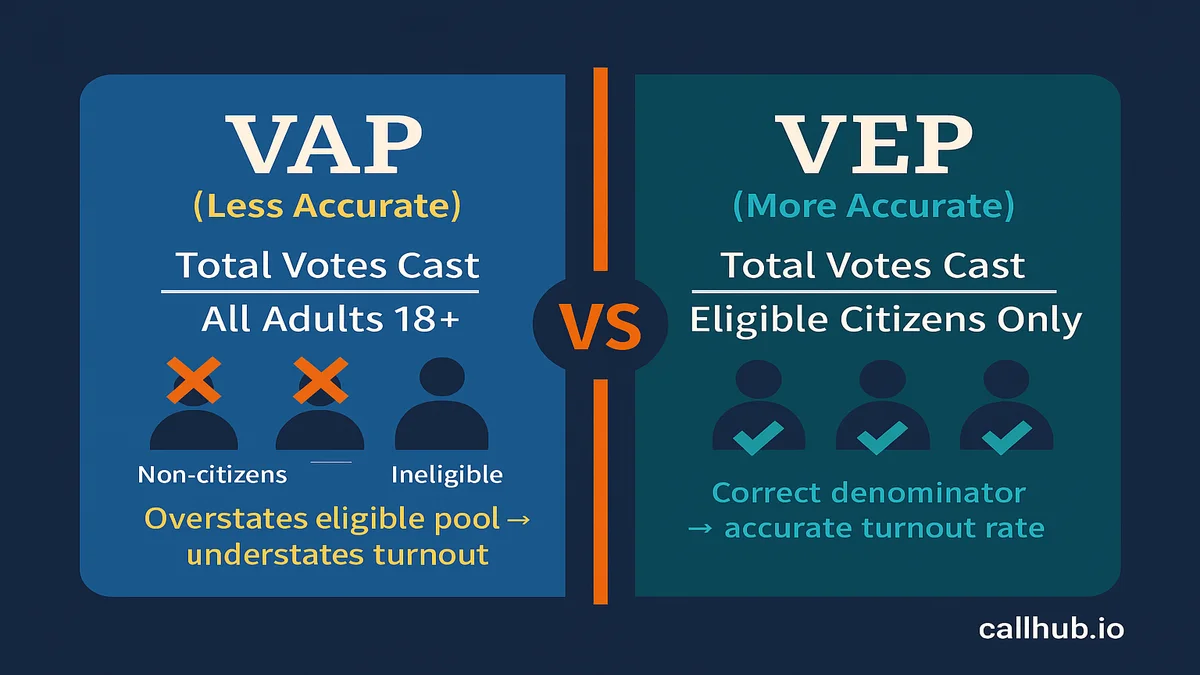
Voting-Eligible Population (VEP) counts only citizens 18+ who are not legally barred from voting, adjusted for state-level rules on felony disenfranchisement. VEP produces a more accurate figure because it uses the actual eligible population as the denominator.
For campaign planning, VEP is the right measure. When researchers report that 2020 presidential turnout was 66.8%, that is a VEP-based number from the U.S. Elections Project at the University of Florida, which tracks historical VEP turnout data and is the standard source for both academic research and practitioner planning.
Voter turnout benchmarks by election type
The formula is only half the story. The election type determines what a realistic turnout baseline looks like.
| Election type | Typical VEP turnout | Source |
|---|---|---|
| Presidential (2020) | 66.8% | U.S. Elections Project |
| Presidential (typical) | 55–60% | U.S. Elections Project |
| Midterm | 49–50% | U.S. Elections Project |
| Local / municipal | 15–27% | Nonprofit VOTE |
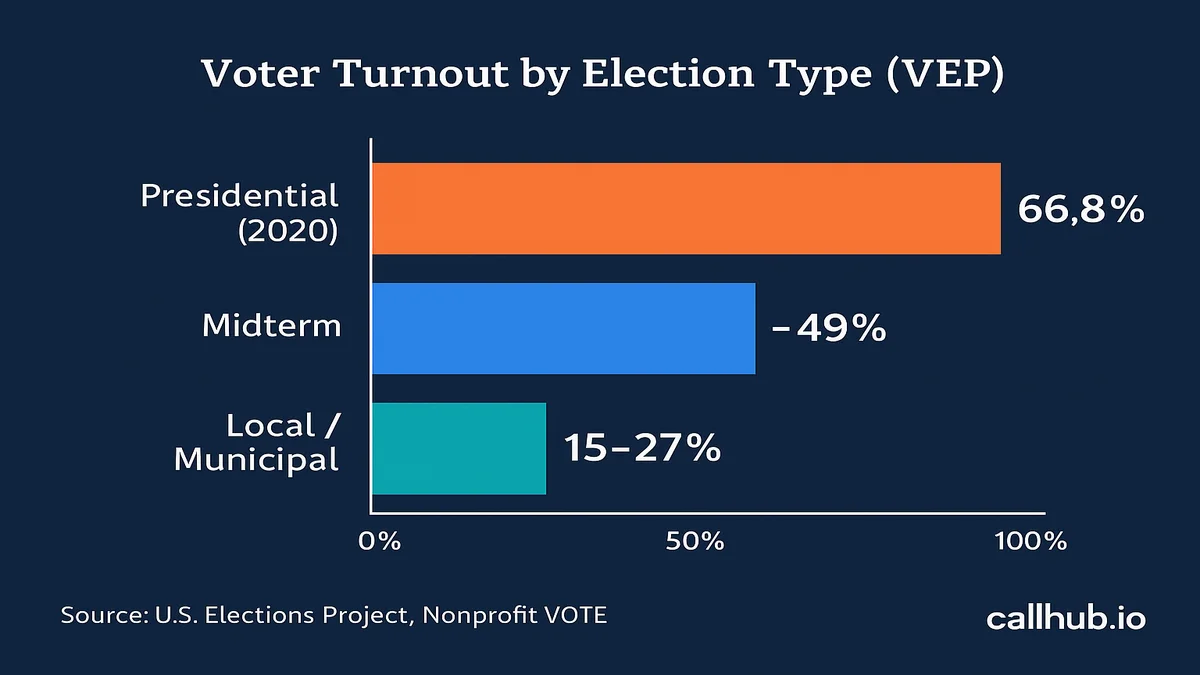
State-level variation adds another layer. In 2020, Minnesota reached 80% VEP turnout while Oklahoma came in at 55%, both in the same presidential cycle. Before building a field plan, look at your specific jurisdiction’s historical turnout for this exact race type, not a national average.
For local elections specifically, the Nonprofit VOTE analysis found that 15–27% is typical, but some municipal races see turnout as low as 10–12%. If you’re running in a city council race or a special election, use a conservative baseline. For a deeper look at why local turnout runs so much lower and how to drive it up, see voter turnout in local elections.
What affects voter turnout?
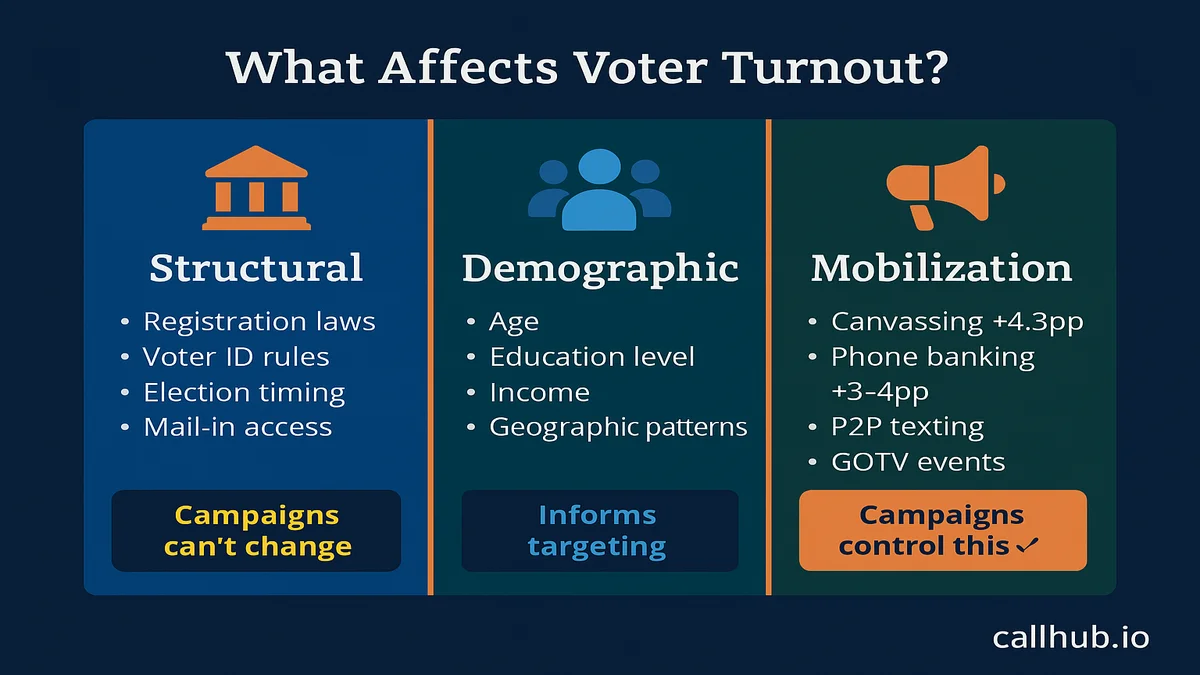
Voter turnout results from three categories of factors: structural factors set by law and electoral administration, demographic factors that correlate with individual voting behavior, and mobilization factors that campaigns directly control. For field planning, the first two inform your baseline assumption. The third is what you invest in.
Structural factors
These are determined by law and electoral administration, not by campaigns:
- Registration requirements: States with same-day voter registration consistently show higher turnout than those with advance registration deadlines.
- Voter ID laws: Strict photo ID requirements are associated with lower turnout, particularly among younger voters and minority communities.
- Early voting and mail-in access: Extended early voting windows and accessible mail ballot options raise turnout. Limited access windows compress it.
- Election timing: Off-cycle elections held outside the November general cycle see significantly lower turnout than on-cycle elections. This is a primary driver of the presidential-to-local turnout gap.
- Ballot complexity: Longer ballots with more contested races draw more voters than single-race or single-issue ballots.
Structural factors set the floor and ceiling for turnout in your jurisdiction. A field director can’t change them, but they explain much of the baseline you’re building your plan around.
Demographic factors
Voter turnout rates vary systematically across demographic groups. Key patterns:
- Age: Voters 65 and older turn out at the highest rates in virtually every election cycle. Voters 18–29 consistently show the lowest rates, though 2020 saw meaningful increases in youth participation.
- Education: Higher educational attainment correlates strongly with higher voter turnout.
- Income: Higher-income households vote at higher rates. The income-turnout gap is especially pronounced in local and off-cycle elections.
- Race and ethnicity: Turnout gaps exist across racial and ethnic groups, shaped substantially by structural barriers, historical disenfranchisement, and disparities in civic infrastructure investment rather than inherent differences in civic motivation.
These patterns inform which segments your campaign prioritizes for mobilization. Mobilizing low-propensity voters (registered but rarely voting) requires more contact attempts per converted ballot, but in low-turnout races, those voters represent the highest available return on field investment.
Mobilization: The factor campaigns can control
Structural and demographic factors explain the baseline. Mobilization is what moves it. For a precise definition of what counts as mobilization versus persuasion or registration, see what is voter mobilization.
The experimental evidence on GOTV programs is unusually strong. Canvassing (door-to-door contact) lifts voter turnout by 4.3 percentage points on average, based on Analyst Institute research on randomized GOTV experiments. Phone banking lifts turnout by 3–4 percentage points, according to Yale GOTV experiments compiled by the Institution for Social and Policy Studies.
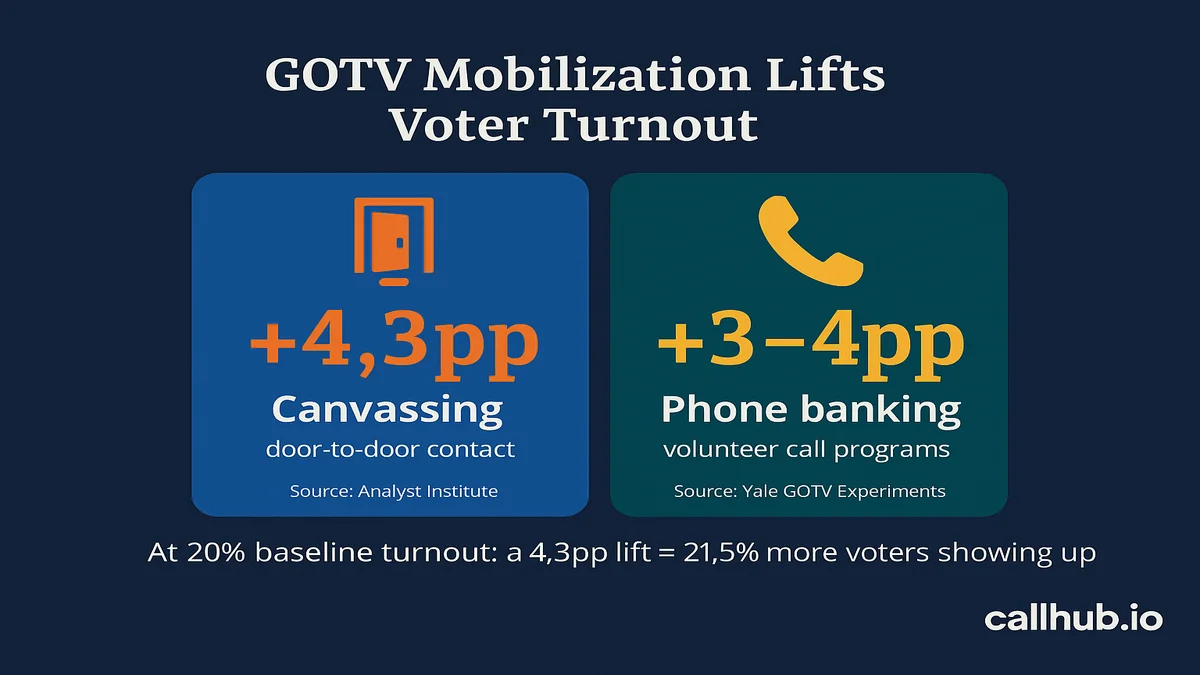
Those numbers have different implications at different baselines. A 4.3-point lift at a 20% baseline is a 21.5% relative increase: You are moving more than one in five non-voters in your contact universe to the polls. At a 65% presidential baseline, the same lift is a 6.6% relative increase. Low-turnout races are where field programs deliver the most impact per contact.
For a complete breakdown of all eight factors and the evidence behind each tactic, see what affects voter turnout.
Why is voter turnout important?
Voter turnout is important because it determines two things no other campaign metric does: how legitimate the outcome reads to the public, and who a government actually ends up representing.
Legitimacy scholars treat turnout as a signal of the strength of a government’s mandate. James A. Gardner, a SUNY Distinguished Professor at the University at Buffalo School of Law, has argued that severely depressed turnout can genuinely threaten a government’s democratic legitimacy — the concern intensifies when people don’t vote because they can’t, and when those barriers fall disproportionately on specific groups. Voluntary abstention among people who could have voted reads very differently than turnout suppressed by structural obstacles.
The second reason is representational. Uneven turnout doesn’t just lower a number, it changes who wins. As the demographic factors above show, older, higher-income voters turn out at consistently higher rates than younger, lower-income voters. When turnout is low, the electorate that actually shows up looks less like the eligible population as a whole, and elected officials answer to the people who voted them in, not to the people who stayed home. A local race decided by a 15% turnout electorate can produce a very different outcome, and a very different set of governing priorities, than the same race decided at 50%.
For campaign organizers, this is also the practical case for GOTV: every percentage point of turnout you add doesn’t just pad a report. It changes who counts.
Why voter turnout matters for campaign organizers
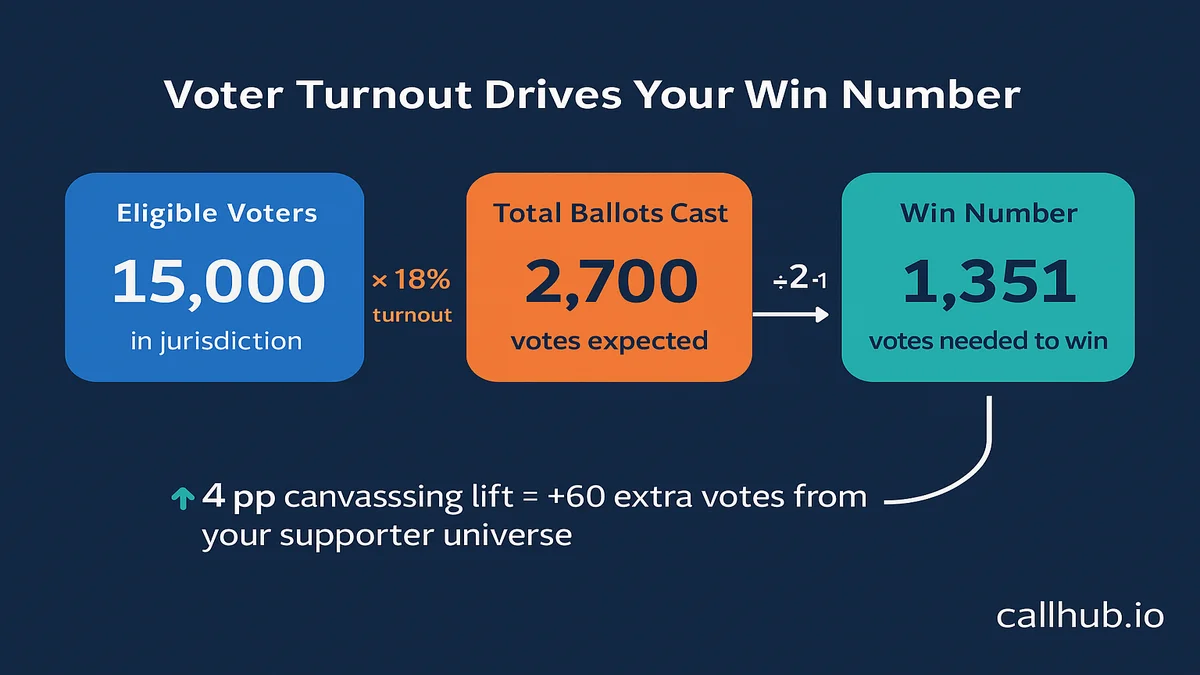
Voter turnout is not a civics metric. It’s a campaign math variable that your win number depends on.
The basic relationship: Your win number is the minimum vote total you need to win. In a two-way race, that’s roughly half of total votes cast, plus one. Total votes cast depends on turnout rate. A change in projected turnout changes your win number.
Here’s a concrete example: A city council race has 15,000 eligible voters. Historical turnout for this race is 18%, meaning roughly 2,700 ballots will be cast. The win number is 1,351. Your campaign has 1,500 confirmed supporters in that universe.
Without a mobilization program, your supporters turn out at the historical 18% rate. You get roughly 270 votes from your own universe. With a canvassing program producing a 4-point lift across your supporter segment, you move roughly 60 more supporters to the polls: 330 votes. In a race where your opponent runs a comparable program and the margin is under 100 votes, that difference is decisive. For the full playbook on running exactly this kind of tight-margin, limited-resource program, see GOTV for small campaigns.
This is also why the turnout baseline you plan against matters as much as the size of your supporter universe. A campaign that plans for 25% local turnout and faces 18% actual turnout has a very different election than projected, on both sides of the equation.
The other reason voter turnout matters: It’s the only post-election metric that tells you whether your GOTV program actually worked. Comparing your precinct-level turnout to prior cycles, and to comparable precincts where you ran no heavy mobilization, is how you measure whether your field investment produced votes.
For the complete field plan framework, the complete guide to get out the vote covers targeting, contact cadence, and election day logistics from start to finish.
How CallHub helps campaigns hit their voter turnout target
Mobilization lift is a function of how many qualifying contacts your program makes before election day. Volume matters, and so does reaching supporters through channels they respond to.
CallHub’s political campaign platform connects phone banking, Peer-to-peer texting (P2P texting), and text broadcasting in one system. Field directors run coordinated GOTV contact programs without managing multiple tools. Volunteer teams log in from any location, work through contact queues with guided scripts, and sync outcomes to the voter file in real time.
The campaigns that hit their voter turnout targets are the ones that make enough qualifying contacts in the final stretch to move the low-propensity voters in their universe. CallHub is built for that volume. See CallHub’s GOTV platform for the full breakdown of how the tools work together to move your turnout numbers.
Start a free trial on CallHub’s political campaign platform or read voter mobilization strategies that move supporters to the polls for a full breakdown of how to structure a GOTV contact program.
Frequently asked questions
What is the average voter turnout in the US?
Average US voter turnout varies significantly by election type. Presidential elections average 55–60% VEP turnout in most cycles, with 2020 reaching 66.8%, the highest since 1900. Midterm elections average 49–50%. Local and municipal elections average 15–27% of eligible voters, according to Nonprofit VOTE analysis. State-level variation within each election type is also significant.
What is considered low voter turnout?
Most political scientists consider anything below 50% VEP turnout low relative to democratic norms. Local and municipal elections routinely fall below 25%, and some special elections see turnout under 10%. For campaign planning, “low” is relative to your specific race type and jurisdiction’s historical baseline. A 22% turnout rate is not low if the historical average for that race is 18%.
What is the difference between VAP and VEP in voter turnout?
Voting-Age Population (VAP) counts everyone 18 and older regardless of whether they are legally eligible to vote. Voting-Eligible Population (VEP) counts only citizens 18+ who are not legally barred from voting. VEP produces a more accurate turnout rate because it uses the actual eligible population as the denominator. The U.S. Elections Project uses VEP as its standard measure, and most political science research cites VEP unless otherwise noted.
How do you increase voter turnout?
The two highest-impact tactics with strong experimental evidence are canvassing and phone banking. Canvassing produces an average 4.3-point turnout lift and phone banking produces a 3–4 point lift, per Analyst Institute and Yale GOTV experiment data. The highest return comes in low-turnout races where the baseline is 15–25%. For a complete strategy, see how to increase voter turnout.
Why does voter turnout vary between presidential and local elections?
Presidential elections benefit from intensive media coverage, top-of-ticket motivation, and months of voter registration activity before election day. Local elections run on shorter timelines with limited media coverage and no major candidate driving turnout. Off-cycle election timing, lower ballot salience, and limited civic infrastructure investment compound the gap. The result is a typical turnout difference of 40+ percentage points between presidential and local race baselines.
How does voter turnout affect elections?
Turnout affects elections in two concrete ways: it changes who wins, and it changes how legitimate the winner’s mandate looks. Because turnout varies by age, income, and other demographic factors, low-turnout elections are decided by a narrower, less representative slice of the eligible population than high-turnout elections, which is why close races often swing on which side does a better job turning out its own supporters, not on persuading new ones. Severely depressed turnout can also raise legitimacy questions about the result itself, particularly when nonvoting is involuntary and concentrated among specific groups.
What is voter turnout in AP Government?
In AP Government and Politics, voter turnout is defined as the proportion of the voting-age population (VAP) that casts a ballot in an election. The course emphasizes registration requirements, voter ID laws, and demographic correlates as primary determinants. Most political scientists and practitioners prefer VEP over VAP as the denominator because VAP includes non-citizens and other ineligible individuals, which artificially depresses the reported turnout rate.