



Table of Contents
Voter turnout is shaped by a combination of election conditions, voting rules, access, personal resources, political engagement, social relationships, campaign contact, and prior voting behavior. No single characteristic determines whether a person votes.
That distinction matters for campaign managers. A campaign cannot change eligibility rules or a voter’s life history in the final weeks. It can make accurate information easier to find, help supporters form a voting plan, remove practical friction, and follow up through the channels most likely to reach them.
This guide explains the eight most influential factors, separates correlation from causation, and identifies what a campaign can realistically influence.
What is the strongest predictor of voter turnout?
In 2013, Kaat Smets and Carolien van Ham went back through decades of individual-level turnout research to find out which variables actually survived replication. Most didn’t. The one that did was almost embarrassingly simple: whether the person voted last time.
That finding has held up. A seven-item habit measure validated on US and UK samples found that past turnout predicts future turnout independently of age, of how interested someone says they are in the current election, and even of whether they say they intend to vote. Education competes closely with it and is usually described as the strongest single demographic predictor, but voting is closer to a habit than a decision, and habits are the most reliable thing on your voter file.
At the aggregate level, the answer changes completely. Wolfinger and Rosenstone argued in Who Votes? (1980) that registration acts as the real screen on participation, and forecasting work at Harvard Data Science Review confirmed it: the number of registered voters in a county or district predicts that jurisdiction’s turnout better than demographic models, competitiveness models, or prior-vote models do.
So there are two honest answers depending on what you’re asking. If you want to know whether a person will vote, look at whether they voted before. If you want to know what a district will do, look at how many people are on its rolls.
Both are targeting insights, not persuasion insights. Which is worth holding onto before you spend a budget on the eight factors below.
What affects voter turnout? A quick answer
The strongest explanations fall into three levels: the election and voting system, the voter’s circumstances and motivations, and the mobilization surrounding that voter.
| Factor | How it can affect participation | Campaign response |
|---|---|---|
| Election salience and competitiveness | High-stakes or competitive elections attract more attention | Explain what is on the ballot and why the election matters |
| Registration and eligibility rules | Deadlines and administrative requirements can create barriers | Share authoritative registration information early |
| Polling and ballot access | Time, distance, disability access, and ballot procedures affect the cost of voting | Provide accurate, location-specific voting help |
| Demographic and socioeconomic context | Age, education, income, and residence often proxy resources and life stage | Segment outreach without stereotyping individuals |
| Interest, information, and efficacy | People are more likely to act when they understand the election and believe participation matters | Use clear information and a concrete voting-plan conversation |
| Social norms and networks | Trusted people and groups can reinforce participation | Mobilize volunteers and relational networks responsibly |
| Campaign mobilization | Timely, personal contact can prompt action and resolve barriers | Coordinate calls, texts, canvassing, and follow-up |
| Voting habit | Prior participation makes voting more familiar and routine | Give newer or irregular voters extra planning support |
Turnout also depends on the denominator being discussed. Voting-age population includes everyone old enough to vote. The voting-eligible population excludes people who are not eligible. Citizen voting-age population includes citizens aged 18 and older. Registered-voter turnout uses only registered voters. Two reports can therefore publish different turnout rates for the same election and both be correct.
The U.S. Census Bureau’s 2024 voting and registration release estimated that 73.6% of the citizen voting-age population was registered and 65.3% voted in the 2024 presidential election. Its detailed 2024 voting and registration tables let readers compare age, education, income, race, residence, and reasons for not voting using a consistent denominator.
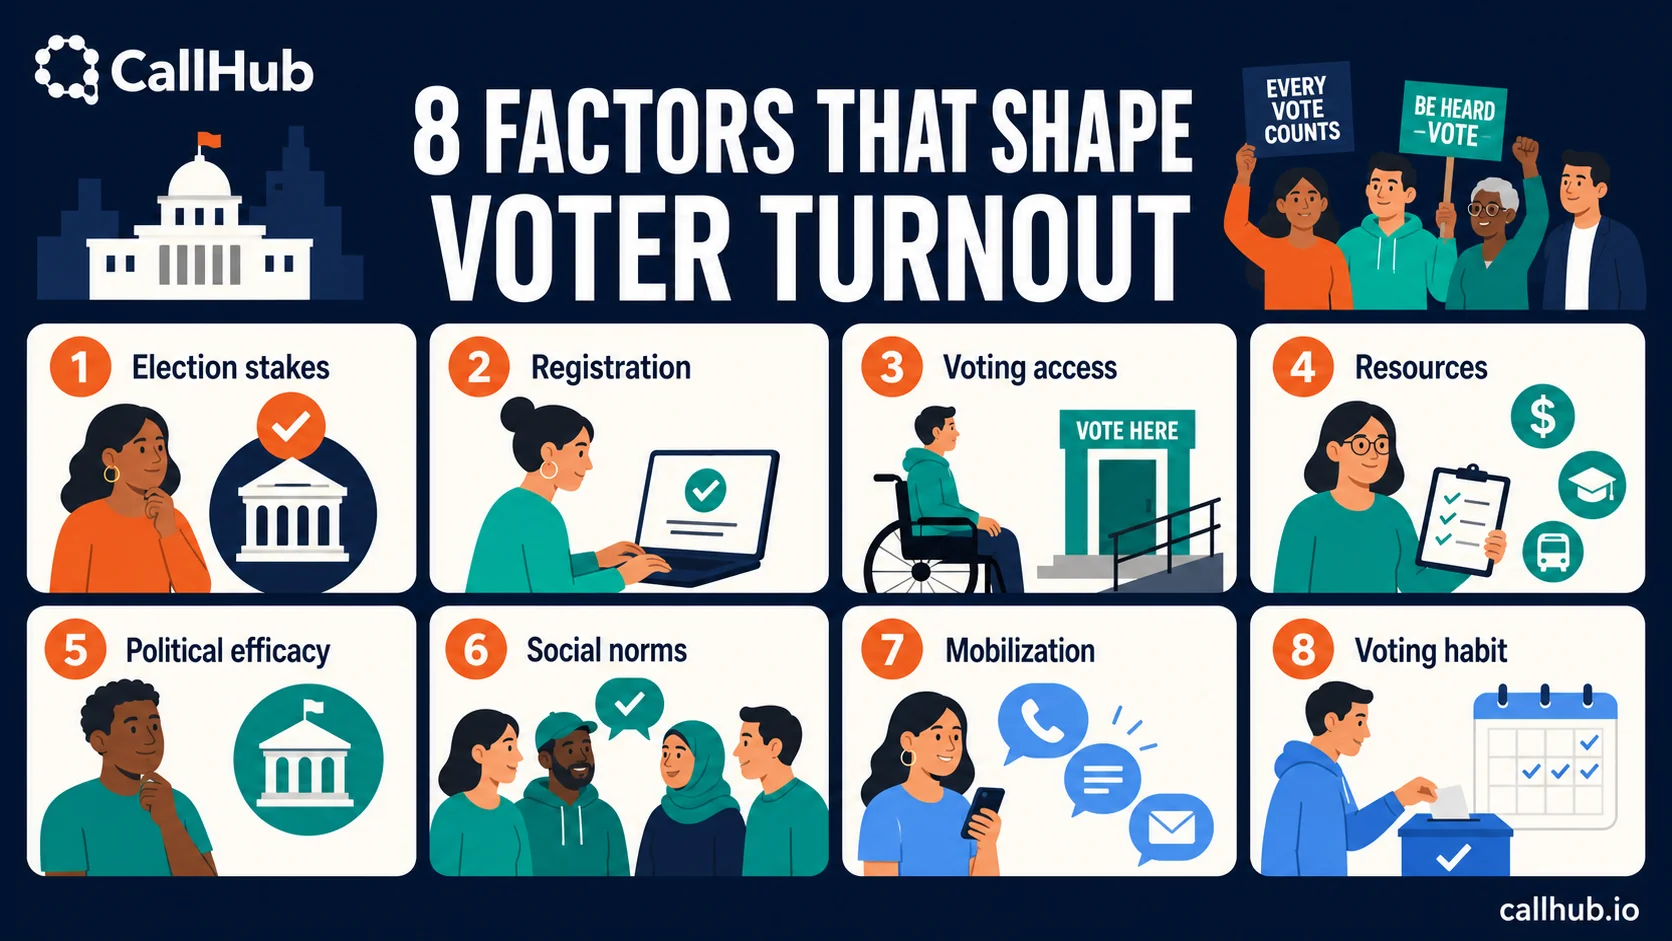
The 8 factors that affect voter turnout in US elections
1. Election salience and competitiveness
Turnout tends to rise when voters perceive an election as important, competitive, or consequential. Presidential elections usually receive more media coverage and campaign spending than local contests. A close race can also convince voters that participation has greater practical value.
Salience is not the same as persuasion. A person may already support a candidate or cause but still need a reason to prioritize voting. A useful GOTV message connects the election to a concrete decision on the ballot and then moves quickly to logistics.
Campaigns should not manufacture urgency or make unsupported claims about a race. They can:
- Explain which offices, measures, or issues are being decided.
- Show how those decisions affect the audience.
- Ask when, where, and how the supporter plans to vote.
This approach fits within a broader voter outreach strategy while keeping the final contact focused on participation.
2. Registration and eligibility rules
Registration systems determine who reaches election day ready to vote. Deadlines, documentation rules, address changes, list maintenance, and restoration of voting rights differ by jurisdiction. These administrative requirements can raise or lower the practical cost of participation.
The U.S. Election Assistance Commission’s 2024 Election Administration and Voting Survey reported more than 158 million ballots counted and documented how states administer voter registration, polling places, mail voting, and election technology. It is a better source for current administration data than a generalized explanation of American elections.
Campaigns can help by sharing official registration lookup tools, flagging deadlines, and directing voters to the correct election authority. They should not guess about eligibility or present legal advice as fact. Where identification requirements apply, use a current, jurisdiction-specific source and review the campaign’s voter identification information before volunteers begin outreach.
3. Polling-place and ballot access
A registered voter can still face friction. Polling locations may change. Work schedules, care-giving, transportation, disability access, long lines, language access, or uncertainty about mail-ballot procedures can interrupt an otherwise firm intention to vote.
The EAC’s voting accessibility resources explain federal accessibility requirements and provide practical information for election officials and voters. Accessibility is not a niche consideration. It belongs in the core GOTV plan.
Campaigns should identify the barriers they can address without over-promising:
- Send the official polling-place or ballot-tracking link.
- Confirm voting hours and available voting methods.
- Offer permitted transportation or accessibility information.
- Escalate election-administration questions to an approved source.
- Record the barrier so the next contact is useful rather than repetitive.
A voter contact plan should define both the message and the escalation path.
4. Age, socioeconomic resources, and demographic context
Age, education, income, race, and residential stability are regularly associated with turnout in survey and administrative data. These variables are useful for describing patterns. They are not complete explanations of individual behavior.
Age and life stage
Age can capture several mechanisms at once: familiarity with registration, residential stability, work and care-giving demands, political interest, and an established voting habit. Younger citizens may have moved recently or be navigating the process for the first time. Older citizens may have more experience but can face health, mobility, or access barriers.
Pew Research Center’s validated-voter analysis of the 2024 electorate found that citizens under 30 made up 20% of the age-eligible population but 15% of voters. That is a group-level comparison, not a prediction about any one young voter.
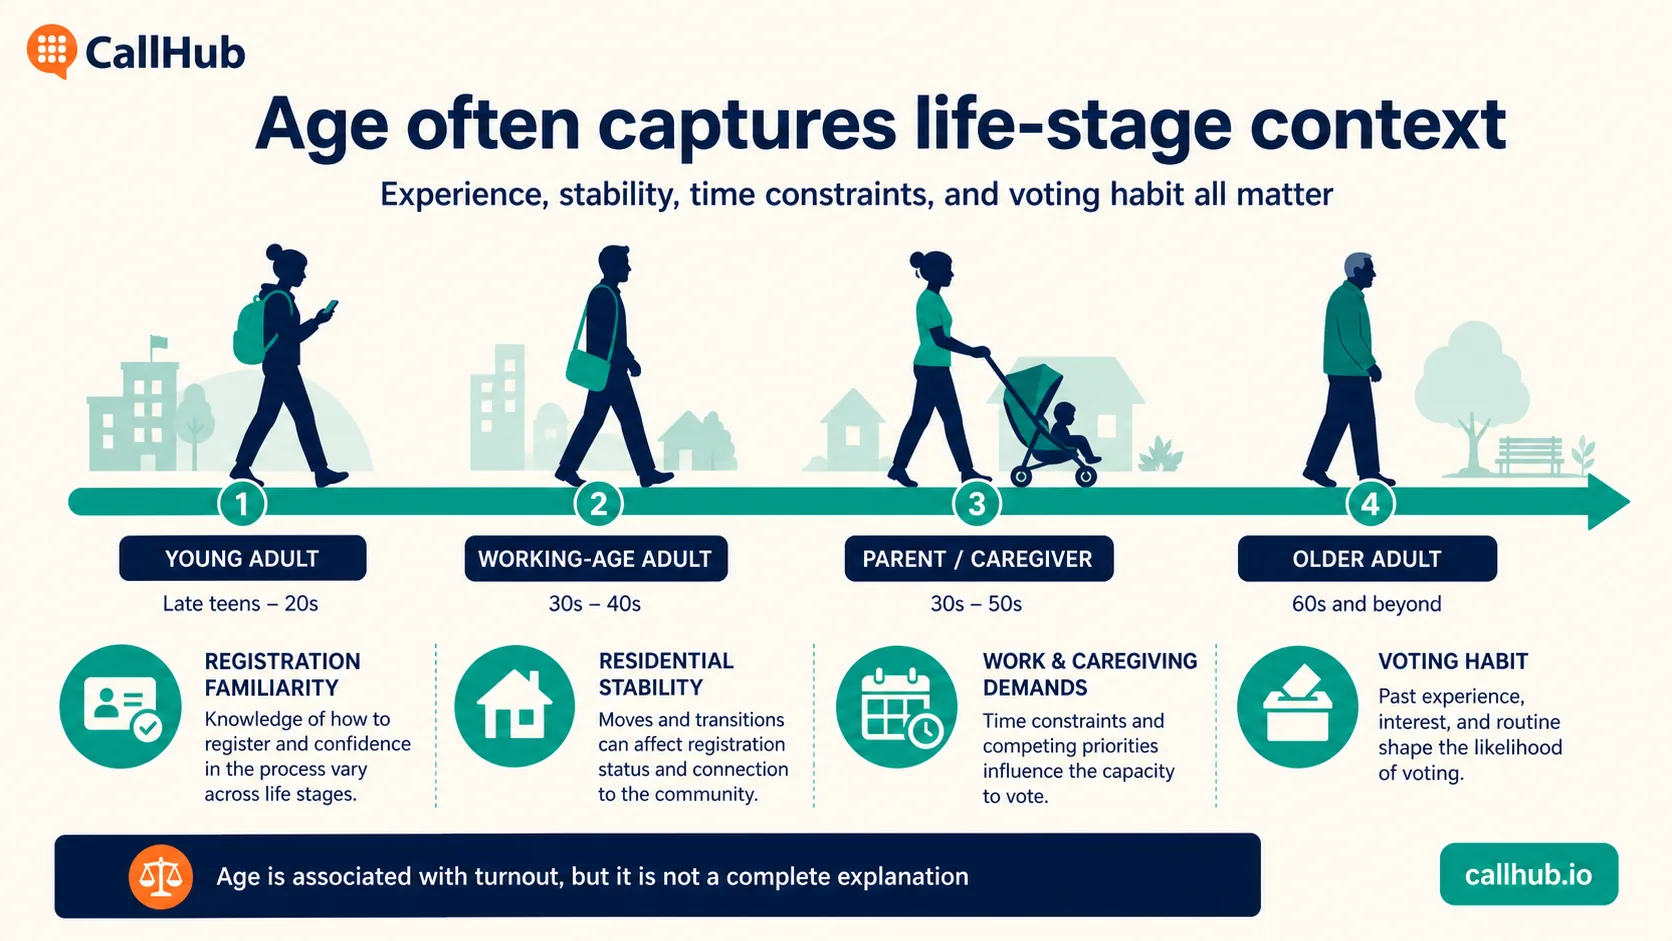
Campaigns trying to engage young voters should test messages and channels, reduce procedural uncertainty, and avoid treating a broad age group as a single persona.
Income and practical resources
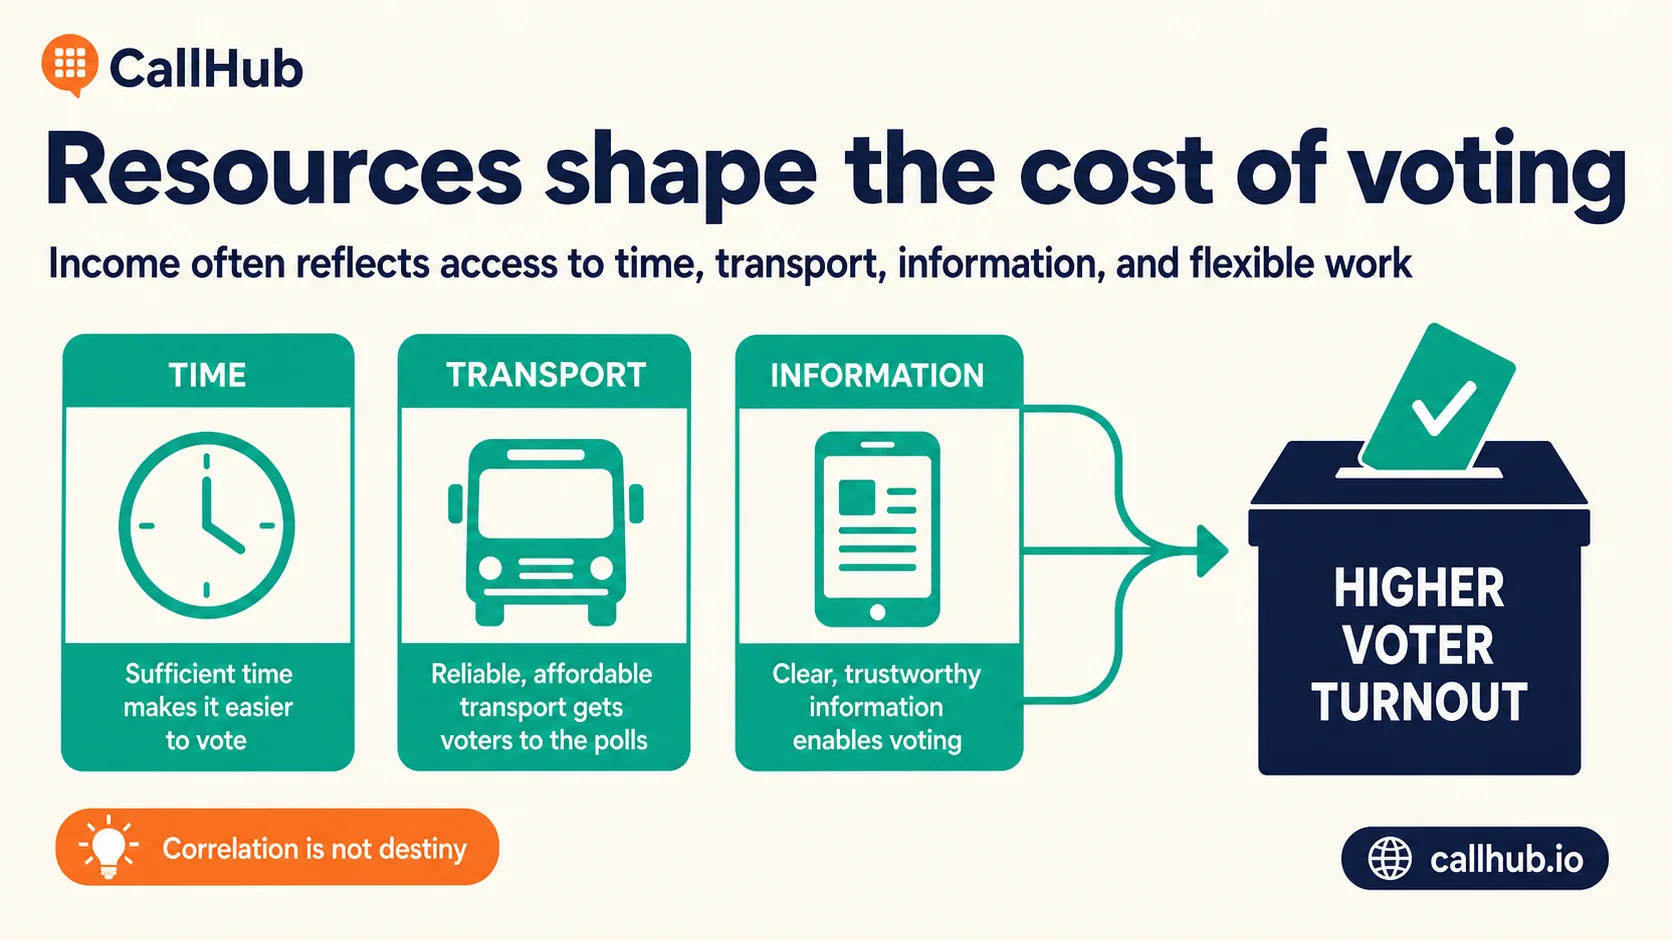
Income often reflects access to time, reliable transportation, flexible work, childcare, information, and stable housing. Those resources can lower the cost of voting. The relationship is not proof that income itself causes participation.
Research discussed by NPR with political scientist Jan Leighley highlights the persistent resource gap between voters and nonvoters. Campaigns should respond to that gap with practical support, not assumptions about motivation.
Education and civic resources
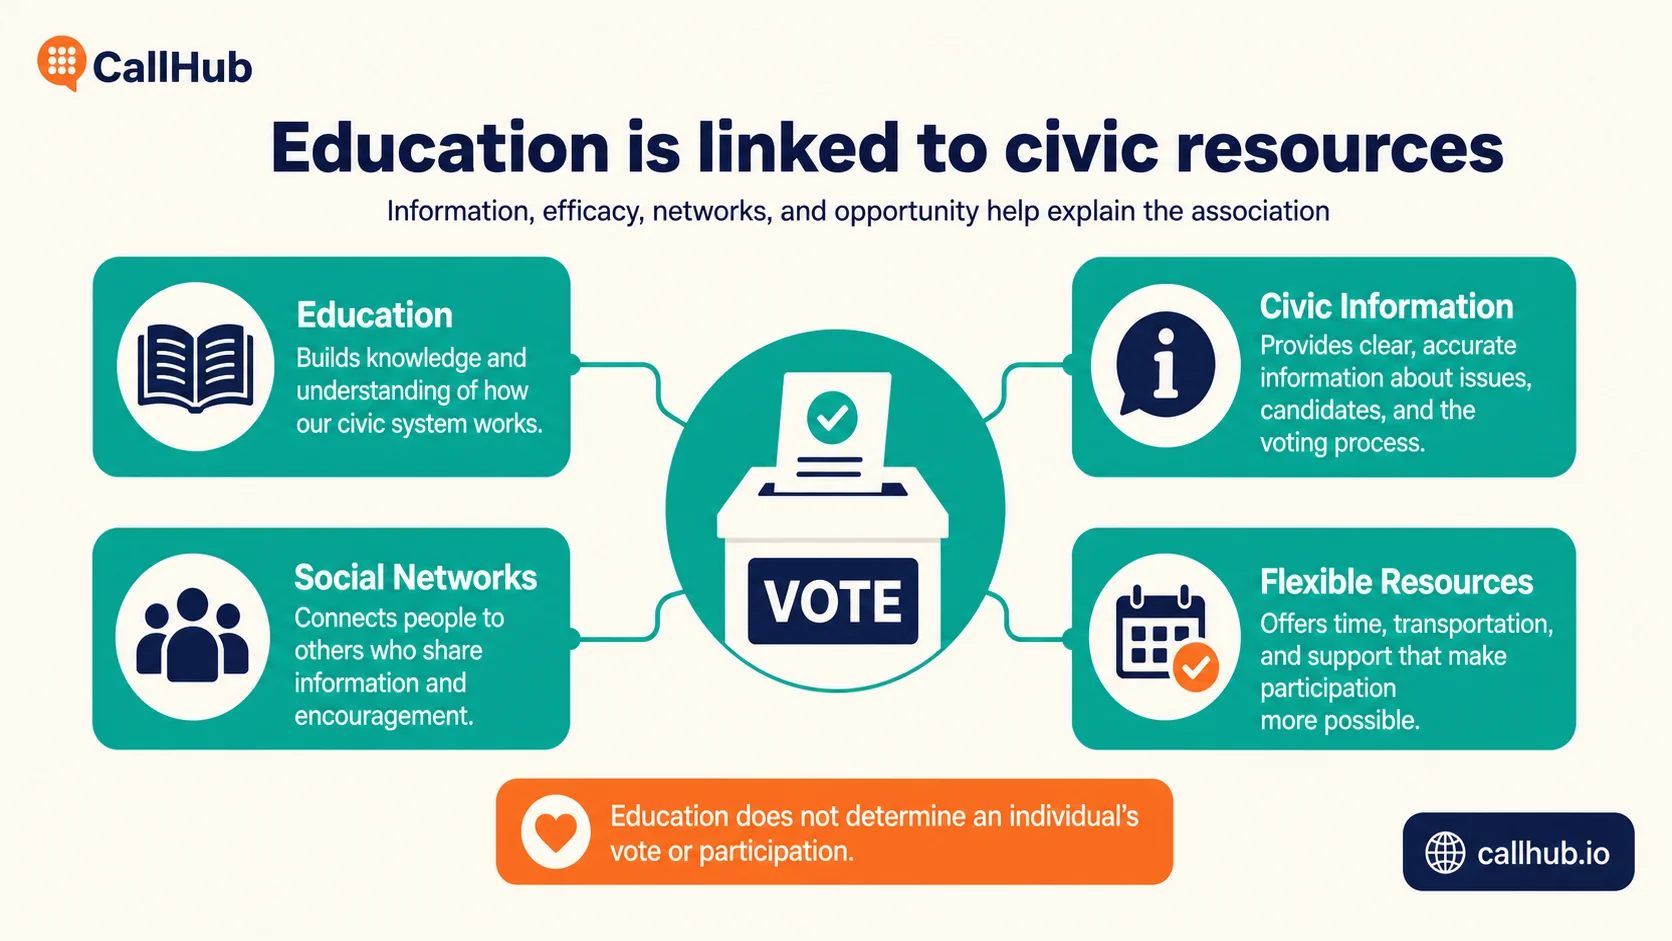
Education is strongly associated with turnout, but it may represent several connected resources: exposure to civic information, confidence navigating institutions, social networks, and economic opportunity. Census data for 2024 reported turnout of 82.5% among citizens with an advanced degree, 77.2% among those with a bachelor’s degree, and 52.5% among high school graduates.
Those figures describe populations. They do not justify rating an individual’s civic commitment by educational attainment.
Race, ethnicity, and historical context
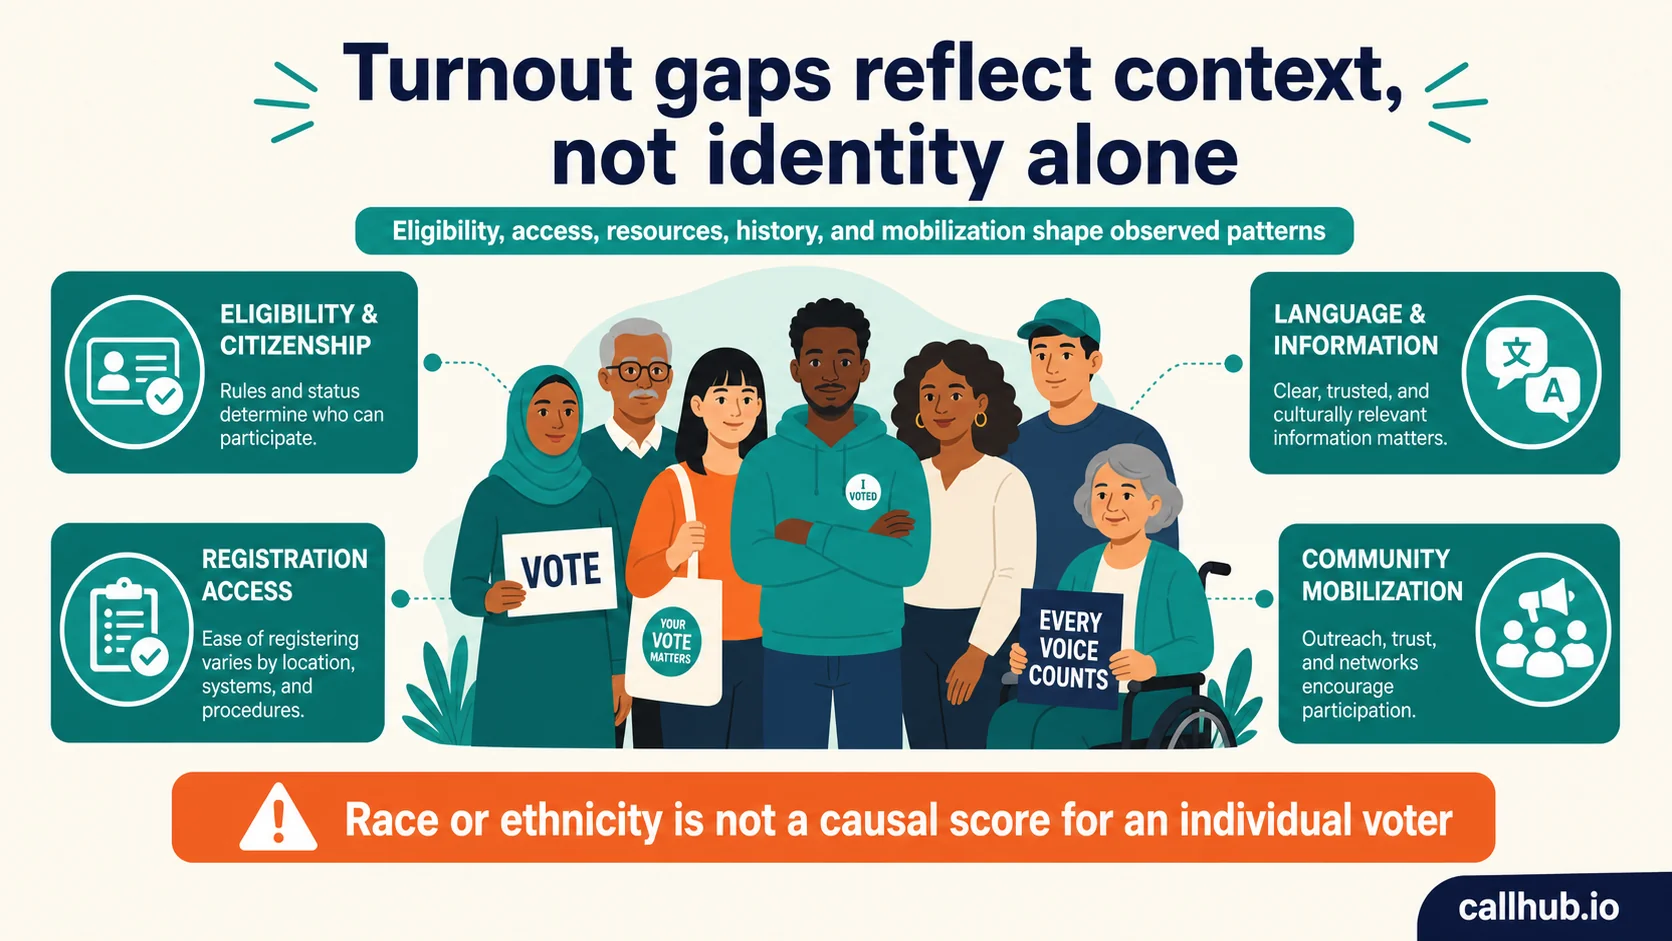
Turnout differences reported by race or ethnicity reflect overlapping conditions including citizenship and eligibility, age distribution, registration access, language access, residential patterns, discrimination, campaign investment, and community mobilization. Race is not a behavioral cause or an individual propensity score.
Campaigns should use demographic data to audit equity and reach, not to create deterministic stories. Compare contact rates and access barriers across segments, then investigate operational causes. A group receiving fewer attempted contacts may appear less responsive because the campaign underinvested in reaching it.
Gender also shows a persistent descriptive gap. The Center for American Women and Politics compiles Census turnout data showing that women have voted at higher rates than men in recent presidential elections. Again, the finding is descriptive, not a substitute for understanding a person’s circumstances.
5. Political interest, information, and efficacy
People are more likely to participate when they pay attention to politics, understand what is being decided, and believe their action has meaning. Political efficacy has two parts: confidence that one can understand and participate in politics, and a belief that institutions are responsive.
Information helps only when it is trusted and usable. A lengthy policy explanation sent the night before election day may increase cognitive load. A short message containing the official polling link, hours, and a reply path can remove uncertainty.
Campaigns should separate persuasion from mobilization. Persuasion asks which choice a voter prefers. GOTV asks whether a likely supporter will act and what could prevent that action. The campaign’s political persuasion guidance and its GOTV guide should therefore lead to different scripts and audiences.
6. Social norms and personal networks
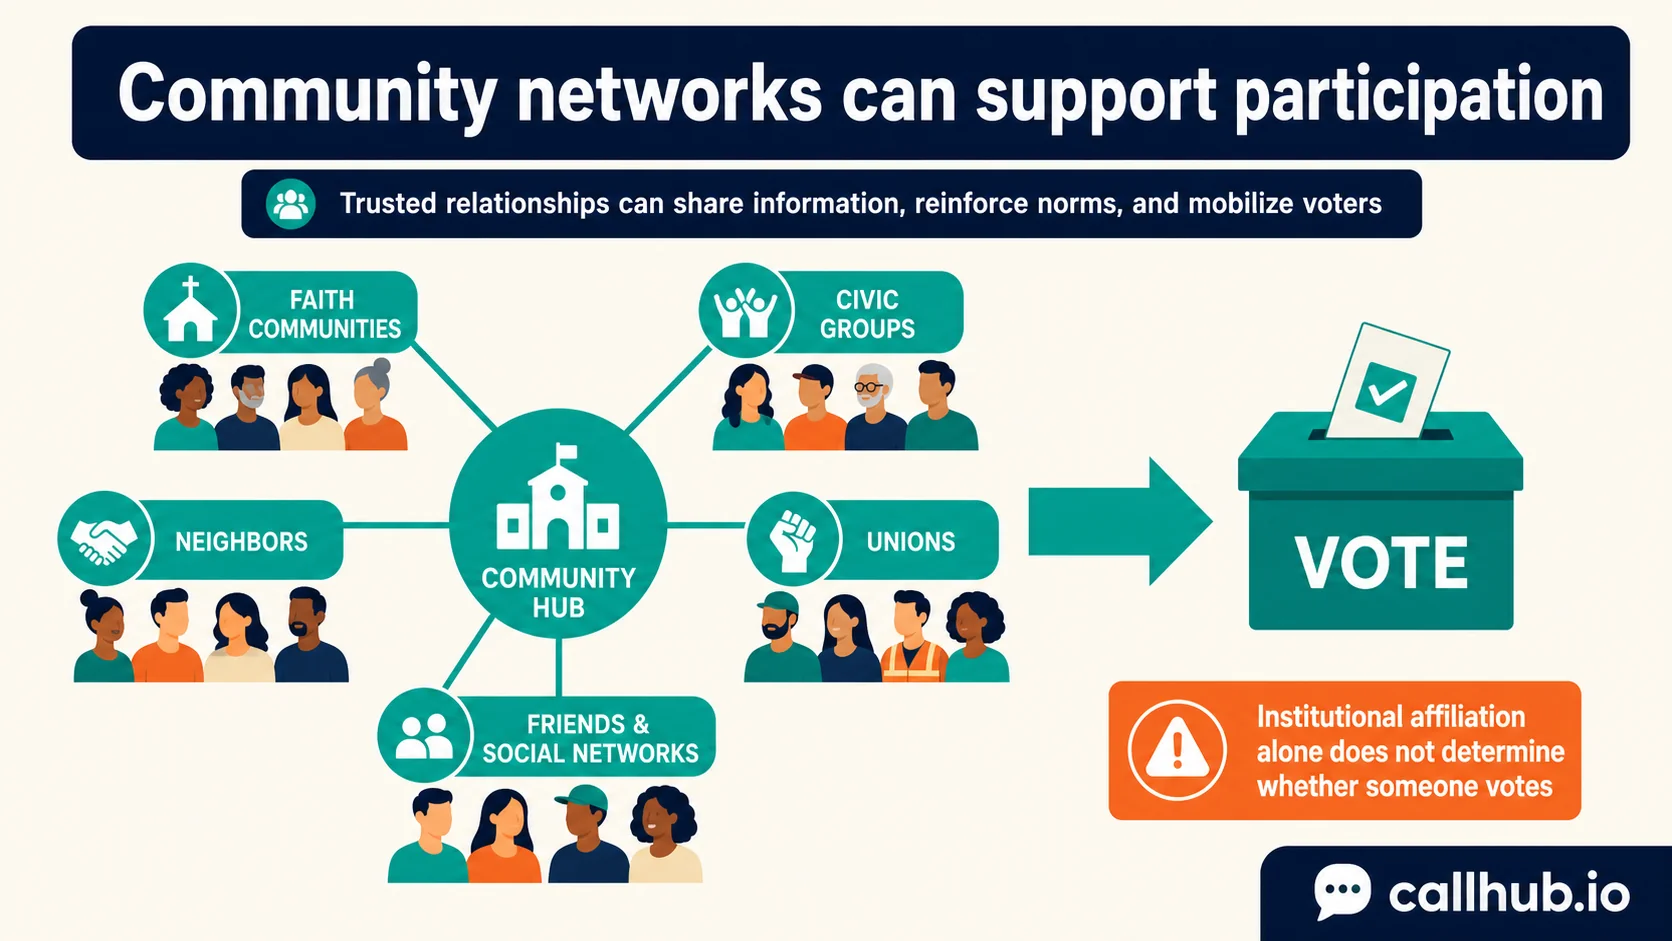
Voting is a private choice, but participation is socially embedded. Friends, family, neighbors, unions, civic groups, and faith communities can share information, normalize participation, and provide practical support.
A large field experiment by Alan Gerber, Donald Green, and Christopher Larimer, published in the American Political Science Review, found that social-pressure mail treatments increased turnout, with stronger effects from more visible pressure. The study demonstrates that norms matter. It does not mean campaigns should shame voters or expose private information.
Ethical relational organizing uses trusted messengers, accurate information, consent, and encouragement. It avoids intimidation and privacy-invasive tactics.
7. Campaign and organizational mobilization
Mobilization can turn an intention into action. Effective contact reminds the voter, makes the next step concrete, identifies a barrier, and creates a way to resolve it. The strongest channel depends on audience, urgency, consent, available volunteer capacity, and the quality of the voter file. CallHub’s GOTV software combines calling, texting, and canvassing tools so a coordinated program can run from a single voter file.
A coordinated program might use:
- Canvassing for high-value, geographically concentrated conversations.
- Phone calls for rapid two-way contact and problem solving.
- Texting for timely links, reminders, and replies.
- Relational outreach for trusted peer contact.
- Follow-up triggered by the voter’s response or disposition.
The goal is not to send the same reminder five times. It is to build a contact sequence in which each channel adds value. CallHub’s guides to voter mobilization, canvassing, and GOTV tools and tactics provide channel-specific planning detail.
The Democrats Abroad case study shows how distributed organizations can use remote contact to reach voters across locations. Review the Democrats Abroad case study as an operational example, not as a universal estimate of program impact.
8. Voting habit and prior participation
Past voting is one of the most useful predictors of future turnout because participation can become familiar and habitual. Prior voters know how registration, ballots, and polling places work. They may also have a stable identity as a voter.
Research on habit formation and political behavior finds evidence that repeated participation can create persistence beyond the immediate election context. Research on early voting experiences and habit formation similarly examines how voting experiences can affect later behavior.
Campaigns use voting history to prioritize outreach, but prior participation is not a guarantee of future participation. A frequent voter can miss an election, and an infrequent voter can be mobilized. Propensity should guide resource allocation, not become a label that denies people contact.
Factors that impact voting behavior
In 2016, 25% of registered nonvoters told the Census Bureau they stayed home because they didn’t like the candidates or the campaign issues. It’s the highest that answer has ever scored, and it sits awkwardly across two questions campaigns usually keep apart.
The eight factors above cover the factors that impact voting, meaning whether a ballot gets cast at all. A different set governs voter behavior once someone has decided to participate: party identification, candidate evaluation, issue salience, and views on incumbent performance.
The 2016 number is what happens when the two collide, and a choice factor gets strong enough to become a turnout factor.
Keep them separate when you plan, and know which one you’re working on. Turnout factors tell you who shows up. Behavioral factors tell you how they vote. If it’s the second one you’re trying to move, [what influences voter decisions] covers that ground.
Structural, behavioral, and campaign factors compared
The eight factors interact. A voter may be highly motivated but face an inaccessible polling place. Another may have easy access but little information about a local election. A third may intend to vote but forget without a reminder.
| Level | Examples | What it explains | Main limitation |
|---|---|---|---|
| Structural | Eligibility, registration, election rules, polling and ballot access | The opportunity and cost of voting | Often outside a campaign’s direct control |
| Behavioral | Interest, efficacy, information, habit, voting plan | Motivation and follow-through | Self-reports may not match validated behavior |
| Social | Family, peers, community institutions, norms | How participation is reinforced or supported | Network effects vary by messenger and context |
| Campaign | Targeting, contact, message, channel, timing | Whether outreach reduces friction or prompts action | Contact is not the same as causal impact |
| Contextual | Age, education, income, race, residence | Population patterns and unequal resources | Correlation can be mistaken for individual causation |
This framework also prevents a common analytical error: attributing every change in turnout to the campaign. Election competitiveness, news events, rule changes, weather, and shifts in the eligible electorate can move turnout independently of outreach.
Why is voter turnout low in the US?
In 2015, Dallas elected a mayor on 6% turnout. Not 6% of the population. 6% of eligible voters. Four years later, Philadelphia’s mayoral race drew 27%, which counted as a good result by big-city standards.
Nobody suppressed those voters. The elections were legal, scheduled, and publicized. So the useful question isn’t why people can’t vote. It’s why people who can, don’t.
The reasons registered voters actually give
The Census Bureau asks people who registered but didn’t vote why they stayed home. Here’s what registered nonvoters said after November 2024:
| Reason | Share of registered nonvoters |
|---|---|
| Not interested | 19.7% |
| Too busy or conflicting schedule | 17.8% |
| Didn’t like the candidates or campaign issues | 14.7% |
| Illness or disability | 12.4% |
| Out of town | 7.4% |
| Forgot to vote | 4% |
| Registration problems | 4% |
Source: U.S. Census Bureau, Current Population Survey, November 2024. Karlyn Bowman’s read of the same tables breaks the numbers out by age and race. (routinely fall below 30%), Weekday voting, the frequency of elections, and registration systems that require voters to opt in rather than be automatically enrolled.
Two things in that table should change how you plan a field program. The top three reasons account for just over half of registered nonvoters, and none of them is a barrier. Interest, time, and candidate dissatisfaction are all motivational.
The second is a trend. USAFacts tracked the same question across presidential cycles and found that access-related reasons were shrinking: registration problems fell from 7% to 4%, and illness or disability fell from 15% to 12%. Meanwhile, candidate dissatisfaction peaked at 25% in 2016 before settling at 15% in 2024.
Access is getting better. Interest isn’t.
The explanations that operate above the individual
Individual reasons still don’t explain why US turnout sits below most established democracies, or why Dallas can elect a mayor on 6%. For that you have to look at the structure of the elections themselves.
FairVote’s turnout research points to four:
- Electoral competitiveness. Voters in the ten most competitive states turned out at 69% in 2020, against a national average of 66%.
- Election type. A 2013 study of 340 mayoral elections found an average turnout of a little above one-quarter of eligible voters. Primaries, off-year races, and runoffs run lower still, with runoffs dropping 38% on average from the first round.
- Weekday voting and election frequency. The US votes on a working Tuesday, more often than most comparable democracies.
- Opt-in registration. Systems that require voters to enroll themselves produce smaller rolls than systems that enroll them automatically.
PBS NewsHour’s reporting adds a point worth keeping in view: election officials, researchers, and legislators who work on this describe the causes as varied and hard to isolate. Treat any source offering you a single explanation with suspicion.
What this means if you’re running a turnout program
If your program is built around removing barriers, it’s aimed at roughly a fifth of the problem.
The larger share of nonvoters were registered, able, and unpersuaded that this particular election mattered enough. That moves the job from access to salience: making one specific race feel consequential to one specific person. Which is exactly what a conversation does and a mailer doesn’t.
It’s also why turnout modeling and contact strategy have to be built together. You already know from the section above that past voting behavior is your best predictor. Combine that with the reasons in the Census table and your targeting question stops being “who is likely to vote” and starts being “who is likely to vote if someone talks to them.” That’s the group your peer-to-peer texting and phone banking volunteers should be spending their hours on.
What campaigns can actually influence?
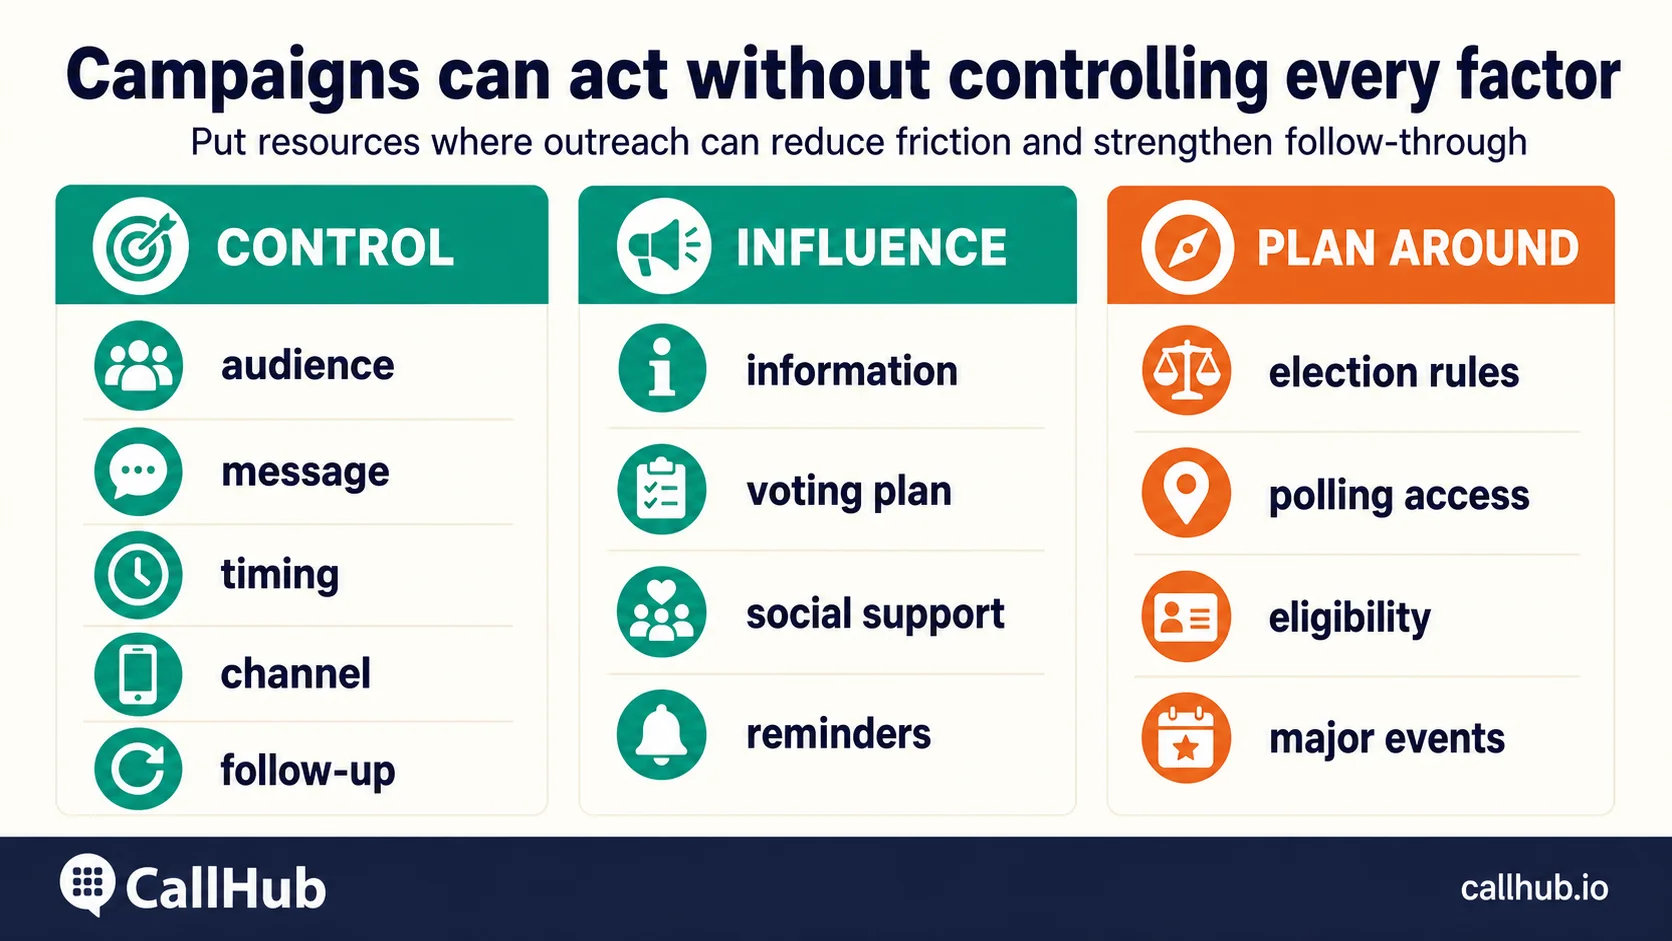
Campaigns control whom they attempt to reach, the message, timing, channel mix, data practices, volunteer training, and follow-up. They can influence whether voters receive accurate information, make a plan, get a reminder, or connect with support. They must plan around election rules, eligibility, polling access, and external events.
A practical program follows five steps:
- Define the voter universe and the turnout behavior the program is designed to change.
- Match contact intensity to voter need and campaign capacity.
- Use a script that confirms identity, provides value, and asks for a voting plan.
- Record attempts, contacts, commitments, barriers, and dispositions consistently.
- Shift resources using contact and response data while protecting a valid comparison group where possible.
If the campaign needs to build participation before GOTV begins, use a voter registration drive and a broader turnout strategy. Registration and mobilization are connected, but they are not the same operational phase — CallHub’s complete guide to GOTV walks through how the two phases fit together.
What campaigns cannot conclude from turnout data
Raw turnout is an outcome, not a complete evaluation.
A precinct’s turnout can rise even if outreach had no effect because the election became more competitive. Contacted voters can show higher turnout because the campaign deliberately selected people already likely to vote. A demographic group can show a lower contact rate because the file had poorer phone coverage, not because the group was less receptive.
Before making a claim, ask:
- What denominator produced the turnout rate?
- Was voting validated or self-reported?
- How was the contact universe selected?
- Did the analysis compare similar voters?
- Were rule changes or external events considered?
- Does the result show association or causal impact?
Track operational metrics such as attempt rate, contact rate, successful-contact rate, voting-plan commitments, barrier resolutions, volunteer productivity, and cost per successful contact. When feasible, use randomized holdouts or a credible matched comparison to estimate incremental effect.
Most importantly, do not turn group averages into individual assumptions. Good targeting uses evidence to determine where another contact may be helpful. It does not decide that someone is unworthy of being asked.
Turnout and vote choice are different questions. If you’re working out what shapes who your voters pick rather than whether they show up, unconscious bias and voter behavior covers the part campaigns usually miss.
People also ask about voter turnout
What are the main factors that influence voter turnout?
The main factors are election salience, registration and eligibility rules, polling and ballot access, socioeconomic and demographic context, political interest and efficacy, social networks, campaign mobilization, and prior voting habit. These factors interact, so no single variable explains turnout in every election.
What is the most important factor in predicting whether an individual votes?
Prior voting is often among the strongest practical predictors because it captures familiarity and habit. Age, registration status, political interest, and election type also matter. Prediction is not causation, and a propensity score should not be treated as certainty.
Why is voter turnout often low in the United States?
Turnout can be reduced by registration requirements, frequent elections, uneven information, low-salience contests, access barriers, distrust, and the practical costs of voting. The exact explanation depends on the election and on whether turnout is measured against the voting-age, eligible, citizen, or registered population.
What factors increase voter turnout?
Competitive and high-salience elections, easier access, clear information, a specific voting plan, trusted social encouragement, timely reminders, and personal campaign contact can increase participation. Their effects vary by audience and context.
How does age affect voter turnout?
Turnout generally rises with age through much of adulthood, but age also captures life-stage differences such as residential stability, political experience, work and care-giving demands, health, mobility, and voting habit. It does not determine whether a particular person votes.
Does the type of election affect voter turnout?
Yes. Presidential elections usually draw more attention and participation than midterm, municipal, primary, or special elections. Competitiveness, ballot importance, media coverage, and campaign investment can narrow or widen that gap.
Do GOTV campaigns increase voter turnout?
Well-targeted GOTV programs can increase turnout, especially when contact is personal, timely, and useful. Results depend on the audience, messenger, channel, execution, and baseline likelihood of voting. Campaigns need a valid comparison to separate program effect from selection bias and election-wide changes.
What is the difference between voter turnout and voter choice?
Voter turnout is the percentage of eligible people who cast a ballot. Voter choice is whom or what that person supports. GOTV focuses on participation among a defined universe, while persuasion focuses on changing preference. Combining the two without a clear strategy can weaken both.