

Table of Contents
According to the U.S. Bureau of Labor Statistics (BLS), the labor union membership trends have remained steady at 9.9% in 2024, representing 14.3 million unionized workers—a slight decline from 2023’s 10.1%, but a major one compared to 20.1% in 1983, when every fifth worker carried a union card.
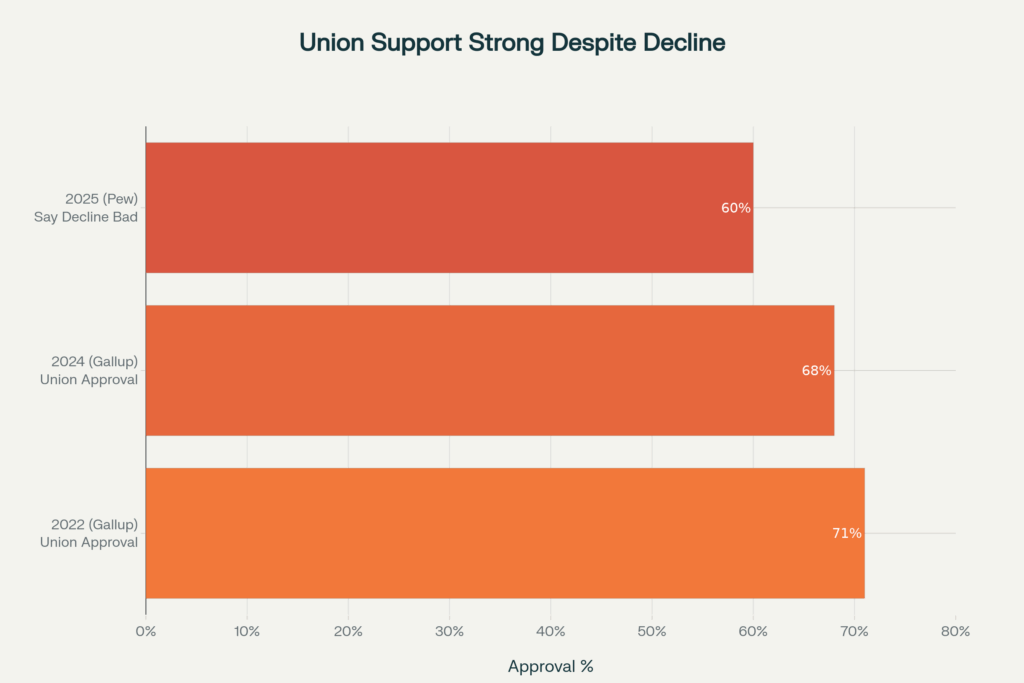
However, it is not as straightforward as it seems. Private sector unions gained 261,000 workers in 2023, the first significant increase in decades. Meanwhile, healthcare unions stood out with an unprecedented organizing drive. Healthcare workers, including doctors and nurses, are unionizing at historic rates, and public approval of unions reached 68% in 2025—the highest level since 1965.
This article examines union membership trends and identifies key takeaways for union leaders to enhance membership growth.
Historical labor union membership trends
The AFL-CIO was founded in 1886 with just 1.4 million members. By the 1930s, unions had delivered:
- Increased wages and overtime pay
- Shorter working hours (40-hour workweek)
- Enhanced workplace safety standards
- Fair employment practices and pension benefits
The peak? In 1954, when 35% of all workers were unionized. The total membership reached its historical high in 1979, with an estimated 21 million members. Since then, decades of economic shifts, legislation, globalization, and employer resistance have steadily eroded union density—until now.
Labor union membership trends by demographics
Let’s explore labor union membership trends by industry, occupation, race, gender, and more key demographic perspectives.
Public vs. private sector: The divide
The split between public and private sector unionization tells the real story:
Public sector union membership rate: 32.5%—more than five times higher than the private sector
Private sector union membership rate: 6.0%—down from a historical high but gaining momentum
Local government workers have the highest unionization rate among all sectors, at approximately 38.4%, particularly in education, law enforcement, and fire services. This concentration partly explains why public sector unions wield outsized political power despite representing fewer total members than the private sector once did.
Read Also: How to Organize a Union and Other FAQs You Always Had
Which occupations are most likely to unionize?
Education, training, and library workers lead at 32.7% unionization, followed by protective service occupations (police, firefighters) at 31.9%. But here’s where the growth story diverges:
Healthcare
Healthcare unionization is surging. Nurses now represent 17.5% unionization—among the highest rates of any occupation—while healthcare practitioners and technical roles have a 12.0% union membership rate, and healthcare support occupations have an 8.2% union membership rate. This sector is the fastest-growing category of unionization.
Compare that to transportation and utilities (16.5% unionized in the private sector), construction (at 9.3%), and manufacturing (8.4%)—and you see healthcare is reshaping the union landscape.
Many of these changes emerged from the COVID-19 pandemic, during which healthcare workers were frontline responders and bore the brunt of the crisis. Combine that with long hours, low wages, and high rates of burnout – you have the perfect recipe for finding strength in the masses.
Transportation and utilities: Still a union stronghold
Despite decades of deregulation and outsourcing, transportation and utilities workers remain among the most unionized, with a union density of 16.5% in the private sector.
This includes truck drivers, warehouse workers, rail workers, and utility operators—occupations where unions have historically been strongest and hardest to dislodge.
Gender: Men still lead, but women are closing the gap
In 2024, 10.6% of working men were union members compared to 9.1% of women.
While the gap has narrowed significantly, men still have higher unionization rates across most sectors.
This reflects historical patterns in which male-dominated fields, such as construction, manufacturing, and transportation, were among the first to unionize—although the growth of healthcare is shifting this balance.
Race and ethnicity: Historical disparities persist
Black and African American workers continue to have the highest union membership rate at 12%, reflecting both their strong presence in unionized public sector jobs (especially education) and their historical role in labor activism.
Union participation by other groups includes:
White workers: 10.1% unionized
Hispanic/Latino workers: 10.0% unionized
Asian workers: 7.8% unionized (down from 8.3% in 2023)
These gaps underscore both the progress unions have made in creating pathways to stable, middle-class work for communities of color and the ongoing organizing challenges in lower-unionized sectors.
Age: The young and the union-curious
Unionization rates vary dramatically by age:
Ages 45–54: 12.0%
Ages 35–44: 11.2%
Ages 25–34: 8.5%
Ages 16–24: 4.4%—the lowest
Young workers face structural barriers: gig work, contract labor, frequent job changes, AI-based layoffs, and decades of anti-union messaging. Yet organizing victories among nurses, warehouse workers, and baristas show younger workers are increasingly willing to unionize when given the opportunity.
Read Also: Mobilize the Workforce: How You Can Use Calling for Unions
Education level: A surprising shift
Union membership among workers without a bachelor’s degree held steady at 11%, while those with advanced degrees hit 15.5%—a striking reversal of the historical pattern where unions protected less-educated workers from wage suppression.
This shift reflects two trends:
- The decline of manufacturing jobs that employed high school graduates, and
- The unionization surge among college-educated professionals, such as nurses, doctors, teachers, and social workers.
Geographic breakdown of labor union membership trends: Where union density is highest
Union membership rates vary wildly by state, reflecting decades of regional economic shifts and political attitudes toward labor.
Labor union membership trends: Which states are highly unionized?
| State | Union Membership Rate |
| Hawaii | 24.1% |
| New York | 20.6% |
| Washington | 16.5% |
| New Jersey | 16.1% |
| Connecticut | 15.9% |
| California | 15.4% |
| Alaska | 14.8% |
| Vermont | 14.3% |
| Oregon | 14.1% |
| Minnesota | 13.3% |
Hawaii leads at 24.1%, driven by strong public sector unionization, agricultural unions, and the hospitality sector’s efforts at organizing.
New York follows at 20.6%, with heavy concentration in NYC public sector jobs, healthcare (especially 1199SEIU’s massive membership), and construction.
Lowest unionization: The right-to-work belt
South Carolina (2.3%) and North Carolina (3.6%) rank lowest. These states enacted “right-to-work” legislation decades ago, which allows employees to opt out of paying union dues while still benefiting from union-negotiated contracts. This “free rider” problem weakens union finances and organizing capacity.
Other low-unionization states include Texas (4.5%), Florida (5.1%), and Georgia (4.7%)—the South’s economic boom has coincided with weak labor protections and aggressive anti-union employer strategies.
The healthcare union story: From afterthought to powerhouse
Healthcare is now the U.S.’s largest employment sector, with over 20 million workers—yet it remained mostly non-union for decades due to fragmented systems and employer resistance. That’s changing fast.
As of 2025, overall healthcare unionization stands at 6.8%, but varies sharply across roles: nurses (17.5%), healthcare practitioners (12%), and support staff (8.2%). Protective services within healthcare are even higher, at 31.9%.
Unionized healthcare workers earn roughly $123 more per week than non-union peers, along with significantly better benefits—57.9 % have retirement plans (vs 43.4 %) and 22.2 % receive employer-paid health coverage (vs 16.5 %). Beyond pay, union contracts often improve staffing, retention, and patient outcomes.
Recent organizing wins underline the shift:
- Kaiser Permanente (Oct 2025): 31,000 workers staged the largest healthcare strike in U.S. history, winning better pay and staffing ratios.
- Northwell Health (Nov 2024): Nurses at Huntington Hospital joined NYSNA, signaling a systemic vulnerability.
- HCA Healthcare (Jan 2025): National Nurses United secured new contracts and wage hikes across major hospitals.
- Physicians organising surge: SEIU’s Committee for Interns & Residents doubled to 37,000+ members by 2025, as doctors turned to unions to tackle burnout and bureaucracy.
Read Also: “Cut our costs by 55%!” NUHW’s Texting Journey with CallHub
Three forces drive this wave: a younger, more union-friendly workforce; post-pandemic staffing crises; and fears of AI-driven job insecurity. Healthcare unions are no longer an afterthought—they’re reshaping the future of the profession.

Why union membership is declining (and why that narrative is incomplete)
The long decline in U.S. union membership stems from several interconnected forces:
- Manufacturing decline: As factories closed or relocated overseas, union-heavy industries suffered significant declines.
- Right-to-work laws: 28 states allow workers to opt out of paying union dues, weakening finances.
- Employer resistance: Companies routinely hire anti-union consultants and delay elections.
- Globalization & automation: Jobs moved abroad or to machines, reducing unionized employment.
- Gig economy growth: Millions now work as freelancers or contractors outside union coverage.
Yet the narrative of decline is incomplete. Public sentiment towards unionizing has shifted—71% approval in 2022, down to 68% in 2024, according to Gallup.
Workers see unions as a way to combat wage inequality, job insecurity, and corporate overreach.
Read Also: How PCS Union Used P2P Texts to Reach 100,000 Petition Signs
Why union support is surging: Labor union membership trends
Despite decades of decline, union approval has rebounded dramatically:
This surge reflects several trends:
- Wage inequality anxiety: As CEO-to-worker pay ratios hit absurd levels (300:1 or higher), average Americans see unions as a counterbalance
- Younger generation shift: Gen Z and millennial workers hold more favorable views of unions than older cohorts
- Visible labor victories: High-profile wins (Starbucks organizing, writers’ and actors’ strikes, healthcare unionization) generate positive media coverage
- Trust in traditional institutions declining: As faith in government and corporations erodes, unions look more appealing
The paradox: more Americans support unions and want to join them, yet membership isn’t rising proportionally. The barrier isn’t ideology—it’s structural. Employer opposition, legal complexity, and labor law gaps prevent millions of union-sympathetic workers from actually forming a union.
Union membership and wages: What’s the real impact?
The union wage premium
Unionized workers earn significantly more than non-union counterparts:
- Union workers (average): $1,263/week
- Non-union workers (average): $1,090/week
- Wage premium: 15.9% ($173/week or $9,000+/year)
This wage gap is higher in the private sector (20% or more) than in the public sector (10-15%), and it is higher for men (18%) than for women (12%).
Benefits and job security: Labor union membership trends
The total compensation advantage is even starker:
- Healthcare coverage: Union workers are more likely to have employer-sponsored health insurance, often with lower out-of-pocket costs
- Pensions: 57.9% of union workers have access to a pension, vs. 19% of non-union workers
- Job security: Union contracts typically include “just-cause” provisions requiring employers to justify layoffs or terminations
- Paid time off: Union workers have higher vacation, sick leave, and paid family leave benefits
The spillover effect: labor union membership trends
Union strength also benefits non-union workers. Research shows that in unionized industries and regions, non-union wages rise as employers raise pay to compete for workers or preempt organizing.
This spillover effect means unions shape wage standards far beyond their membership. Herd immunity – isn’t it?
What should union organizers and leaders do: Labor union membership trends
Union organizing and increasing membership have always been uphill battles. But like every game has a power-up, union leaders can also bank on the surging approval for unionizing.
Reaching out to younger workers, women, and carving a path forward is a must. Especially today, when capitalists are being promised a trillion dollars in compensation while SNAP benefits are being taken away from the people.
If you want to reach more workers and learn how to increase union membership, then we have just the right resource for you. Check out CallHub’s article Your guide on how to increase union memberships in 8 ways to learn more.
FAQs on labor union membership trends
What was the peak of union membership?
The union membership rate reached its peak at 35% in 1954. The total number of members peaked in 1979 at 21 million—meaning today’s 14.3 million members represent both a declining rate and a lower total than four decades ago.
Is union membership growing or declining in the private sector?
Growing in 2024-2025. Private sector unionization gained 261,000 workers in 2023, increasing the rate from 6.8% to 6.9%. This marks the first significant private sector gain in years, driven largely by victories in the healthcare, tech sector, and retail/logistics sectors.
Why are young people not joining unions?
Three reasons: (1) structural—gig work and contract labor make organizing difficult; (2) informational—decades of anti-union messaging have shaped younger generations’ perceptions; (3) practical—legal barriers and employer intimidation make union formation feel impossible to many young workers.
However, organizing victories show that young workers will unionize when given the opportunity.
Can declining union membership be reversed?
Yes. It requires: (1) federal labor law reform (PRO Act), (2) state-level repeal of right-to-work laws, (3) stronger NLRB enforcement, (4) modernization for gig and service workers, and (5) a cultural shift reframing unions as essential to middle-class stability.
Several economists and policy experts argue that this shift has already begun—public support is strong, and organizing energy is high. Policy is the missing piece.
When did unions start to decline?
Union membership began declining in the late 1970s, accelerating in the 1980s under the Reagan administration’s policies. The Taft-Hartley Act (1947) began the process; globalization and deindustrialization of the 1970s-1980s accelerated it; and right-to-work legislation in subsequent decades institutionalized it.