

Table of Contents
What affects voter turnout is a question dear to many political campaigns and pundits. Understanding the causes that influence a person to cast a ballot or decrease their likelihood of voting paves the way to
- Understanding optimum forms of voter outreach
- Categorizing electorates for personalized voter persuasion
- Driving informed Get Out The Vote (GOTV) campaigns.
Understanding what affects voter turnout means knowing the root cause to tackle when strategizing mobilization campaigns.
A person’s likelihood to vote can change depending on their age, location, and economic conditions. But, it is also influenced by more permanent characteristics like ethnicity, education, and gender. This blog will cover what influences voter turnout—from the basics to the more nuanced.
| What is voter turnout: Voter turnout is the percentage of registered voters who cast a ballot in an election. |
What are the three main factors that influence voters?
A variety of factors determines voting rates and individual probability of polling turnouts. On a high level, researchers have studied three cleavage-based voting factors: Class, gender, and religion.
What affects voter turnout: Class
The likelihood of a person voting is directly related to their income and wealth, making them two crucial factors in determining voter turnout. Jan Leighley, a political scientist from the United States, writes that about 80% of high-income earners vote, whereas only ~50% of lower-income groups do.
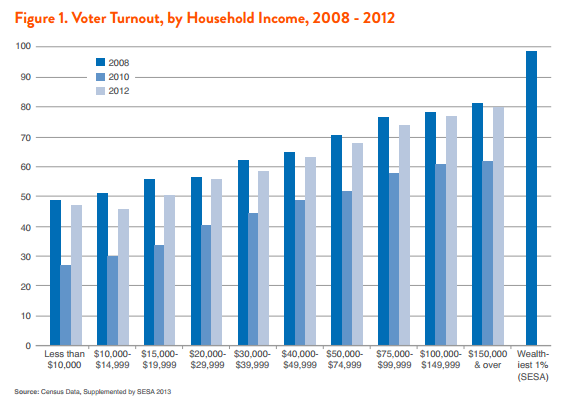
This trend is as true in the USA as it is in other countries around the world.
What affects voter turnout: Religion
In yesteryears, political leanings and choices of political leaders were largely influenced by religious beliefs. However, whether someone is religious wasn’t the question—a person’s support was influenced by what religion or denominations within religion they and the leaders followed.
Over the last decade, another category has emerged: Non-religious voters. And non-religious people are more inclined not to vote.
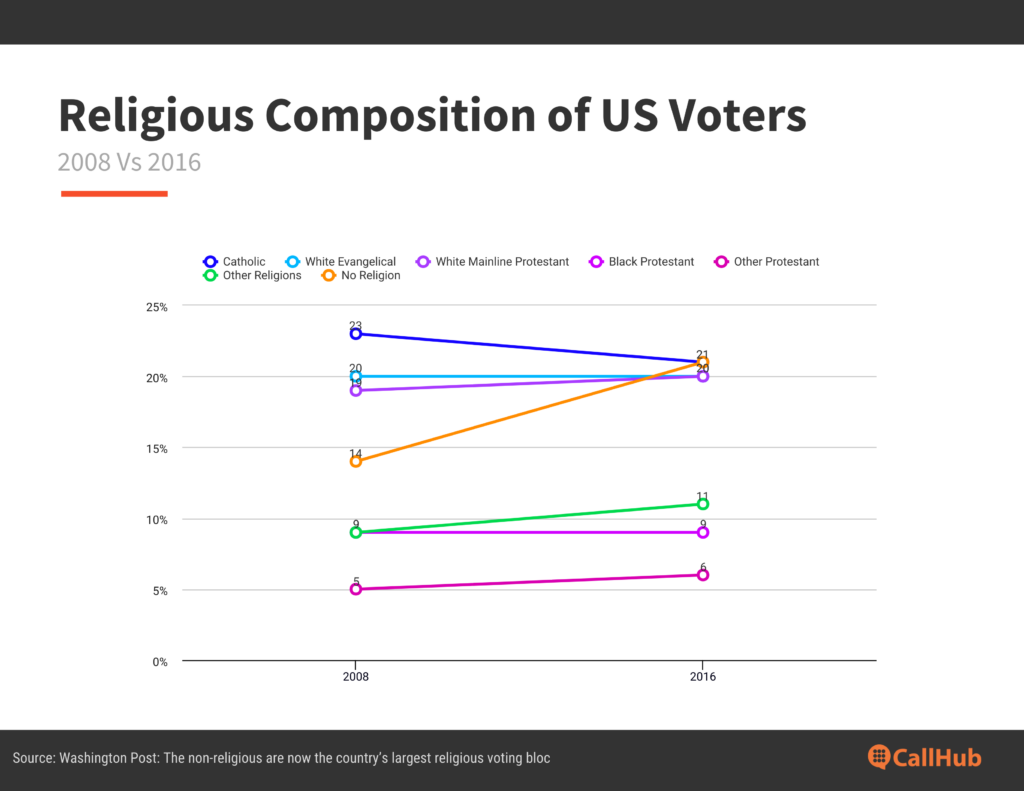
In 2016, 21% of the voting-eligible population said they were non-religious (do not visit places of worship OR agnostic OR atheist). Still, they constituted about 12% of the electorate—consistent with the 2008 share, although back then, only 17% of people were non-religious.
Christopher Ingraham of the Washington Post cites two possible reasons for non-religious people forming this voting bloc:
- Religious institutions like the church carry out GOTV activities that do not reach (or are avoided by) the non-religious.
- Many non-religious people are young (the median age is 36 years)—a demographic that traditionally votes less.
What affects voter turnout: Gender
1980 was the last year when the voter turnout percent for men and women was equal in USA presidential elections (64%). Since then, every presidential election has seen a higher turnout of women than men—typically a 3-4% gap.
In non-presidential elections, this gap is not so pronounced, but women have still turned out to vote more than men since 1980. The widest gender gap (recorded) in voter turnout for non-presidential elections was in 2018 when 51.8% of eligible men and 55% of women voted.
*Studies show that voter registration and identification laws create significant barriers to the transgender community, affecting their turnout during elections. The statistics mentioned above do not necessarily include the trans community.
What factors have the strongest influence on individual turnout?
Voter turnout is a mix of two factors:
- Internal (motivation, eagerness, knowledge) and
- External (eligibility, mobilization, voter suppression).
We saw the three cleavages affecting voter turnout, which were a mix of internal and external factors. Now let’s look at other determinants of what affects voter turnout.
| If we were to assume that humans act completely rationally, the likelihood of someone voting could be calculated with the formula: V=PB+D>C. Here, V= Probability of person A voting P= Probability of A’s vote affecting elections B= Benefit of A’s preferred candidate winning to A D= Feeling of civic duty, goodwill, altruism, or psychological benefit of voting C= Cost of voting in terms of time, money, or effort. If PB+D is greater than C, the person is likely to vote. If it is less than C, the person is unlikely to vote. |
Age
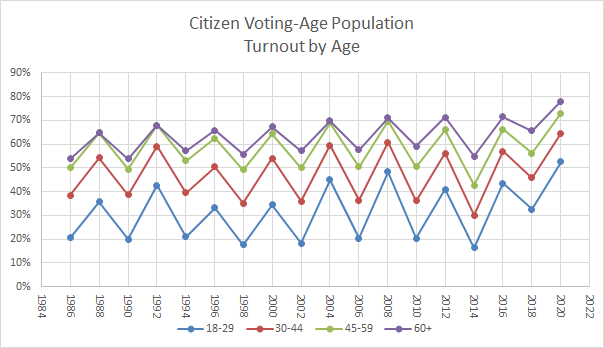
Younger people are less likely to turn out to vote than when they turn old. In the 2020 Presidential elections, 51% of electorates between 18-24 years voted as compared to 76% of those between 65-74 years.
We look at the relationship between age and voter turnout in further detail in the section “What age group is more likely to vote?”
Education
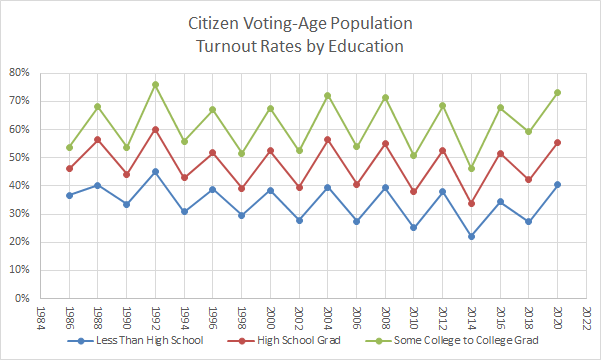
Much like age and income level, education level is also directly related to voter turnout. Education and its relation to turnout are among the most widely studied and crucial factors of voting rates. Although challenged by some, recent studies have concluded that higher levels of education are causal to higher turnout.
Race
How a leader’s proposed policies affect one personally is a huge determinant in supporting or opposing them. Race and ethnicity are significant factors in this.
At the same time, race also gives a reasonably accurate estimate of the likelihood of someone voting.
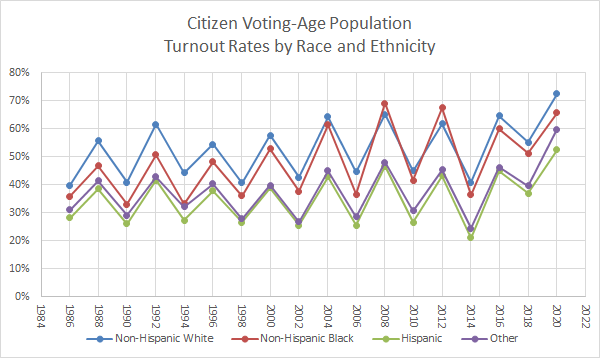
Traditionally, the white non-Hispanic population took the lead in turning out to vote. However, that scene has changed since 2000, and Hispanic voters have taken that major share since. In the 2012 elections, Black voters had the highest turnout overtaking White voters for the first time in history. However, the share went down again in 2016.
This chart shows the most updated stats on voter turnout by race.
Marital status and family
Married couples without children have the highest turnout share in US elections, followed by married couples with children. People who have never married are more likely to vote than those previously married (now separated, divorced, or widowed). The same study also found that separated ex-couples with children were least likely to vote than other types of single or married couples.
Moreover, parents of newly enfranchised voters are 2.8% more likely to vote. Essentially, in the USA, a person is more likely to vote if they have others in the family who also vote.
On an individual level, the likelihood of voting increases with age; as one can reasonably presume, education levels and/or income levels increase. There’s a slight downward trend once children come into the picture or if faced with relationship hazards.
Of course, these personal factors cannot operate in isolation and are often influenced by sociological determinants. Let’s look at them next.
Voter registration laws
Strict voter registration laws that demand a two-step process or require strict voter identification can reduce voter turnout. Many partisan advocacies and groups have protested against such laws, citing discrimination against minorities.
The comparatively low turnout among minorities can at least partially be attributed to such laws. These minority groups include (not an exhaustive list):
- Lower-income groups
- Hispanic communities
- Non-Hispanic black communities
- Transgender people
We have a detailed article on voter identification laws. Do read it and share relevant information among electorates during your mobilization campaigns: Your Quick Guide to Voter Identification Laws in the US.
Other factors that affect voter turnout
| Factor | Condition | Likelihood of voting |
| Political interest | High interest and awareness of the political landscape | Does not guarantee turnout in the USA |
| Organizational membership | Active GOTV campaigns by the organization | Increases turnout |
| Partisan mobilization | Informative and timely voter mobilization | Increases turnout |
| Non-partisan mobilization | Informative, timely, and non-intrusive mobilization | Increases turnout |
| Childhood influences | Improved social skills and early childhood education | Increases turnout |
| Mental Health | Depression and anxiety | Decreases chances of turnout and has no significant effect, respectively |
| Population size | Population density of a city (not of a house or neighborhood) | Has a minor influence on decreasing turnout |
What age group is more likely to vote?
If your target persona for GOTV is young people, I have bad news. Youths between the ages of 18 and 29 have a consistent lowest turnout rate in US elections. If you are targeting this group, you will need more persistent canvassing, persuasion, and GOTV strategies (guides given below).
But things improve as one gets older.
This is assuming that with age, one tends to become more
- Financially stable
- Politically aware and active
- Involved in organizations and groups that engage in mobilization.
This trend of older people turning out to vote more than the young is similar across countries. Thus, countries with a higher average age see higher voter turnout than younger countries. You’ll see a similar pattern if you compare states within the US too.
However, turnout among young voters is redeemable. For one, sending informative material about candidates can improve voter turnout by 0.9%.
How does the type of election influence voter turnout?
Typically, elections of national importance and primary elections attract a higher turnout than local or run-off elections. At times, local elections (e.g., mayoral elections) draw less than 10% of the electorate to the polling booths.
Here’s a quick rundown of the elections that traditionally have high and low turnouts:
| High turnout elections | Low turnout elections |
| * Primary elections * Congressional elections * Presidential elections * First-round elections | * Off-year elections * Run-off elections * Mayoral and other local elections * By-elections to fill vacancies * Midterm elections |
It is important to note that voter turnout rates are contextual. Whether turnout was low or high is determined by comparing the closest comparable election. For instance, midterm elections have a ~40% turnout rate which is lower than the presidential election rate of 50-60%. However, it is much higher than mayoral elections, which can get a 26% average turnout rate.
Do GOTV efforts affect voter turnout?
Partisan and non-partisan mobilization efforts increase voter turnout during important elections. These campaigns come in multiple phases:
- Informative: When you identify supporters and share information about your campaign with them.
- Registration: Campaigns target identified supporters and motivate them to register to vote.
- Voter persuasion: Campaign staff and volunteers engage in personal conversation, solving doubts and clarifying issues to persuade undecided supporters to vote for you.
- Canvassing and mobilizing: Mobilizing voters in person or over texts, calls, and social media posts to vote on election day.
- GOTV: The final nudges to get supporters to vote.
Together, these touchpoints help in increasing voter turnout—and especially the turnout of your confirmed supporters. We have detailed guides on each of these processes for optimum results. Read them here:
Feature image source: Unseen Histories/Unsplash.